To truly understand Pierre Andurand’s performance pullback in 2018, it’s necessary to look at his longer-term track record. Andurand Capital’s performance since February 2013 has earned it The Hedge Fund Journal’s CTA performance award for the discretionary commodity trading category. This has been against a challenging backdrop for many peers in the space, some of which have shut down. Andurand’s personal career track record, dating back to 2004, includes his former fund, BlueGold, proprietary trading at Vitol, and a couple of short gaps. Taken together these three track records add up to average annual returns of just over 30%, which, if stitched together, would have compounded up to 3,109% as of the end of April 2019.
Moreover, the return profile has been asymmetric and positively skewed, hence the Sortino ratio – which focuses on drawdowns – is above two, and ahead of the Sharpe ratio, which penalises upside and downside volatility equally. This pattern comes from Andurand having often been explicitly long of options. Even when trading linear instruments, his style of risk management to some extent synthetically replicates the payoff profile of owning options. The portfolios are entirely liquid, so that risk can be swiftly cut when needed.
30%
Andurand’s personal career track record, dating back to 2004, add up to average annual returns of just over 30%.
Risk management
The 20% loss in calendar year 2018 is, probabilistically, perfectly consistent with the strategy’s volatility of around 20% – it is clearly one annual standard deviation. By way of comparison, on a volatility-adjusted basis the 2018 loss is not dissimilar to the 2011 one (of 34%) at BlueGold. This was one factor leading Andurand Capital to institute a tighter risk management framework than the one used there.
Andurand’s peak to trough drawdown in 2018 was larger than the calendar year loss because the strategy had been in positive territory after call options on oil moved into the money. The timing of losses illustrates how the options automatically reduced risk: most of the loss occurred in October and gave back previous options profits. There was also some active risk management: on the way up, Andurand top-sliced some profits; accumulated some put options, and shorted some futures against the calls. By November and December, risk had already been reduced to the lowest of five categories, “zone 5”, which requires a two-week risk-off phase. It then reverted to “zone 4”, which caps forecast daily 95% VaR at 1%, gross leverage at 200%, and net exposure at +_50%.

Pierre Andurand, Andurand Capital. Photography: Benedict Tufnell.
Though Andurand has been bullish in 2019, being in this risk zone for the first quarter of the year has constrained his ability to rebuild exposure. He reflects, “Every risk management system has its pros and cons. The current system used works well in trending markets but less well under the V-shaped recovery scenario seen in late 2018 and early 2019. Over this period the risk system has been frustrating: it has essentially crystallised the majority of losses, while making it more difficult to recover the drawdown.”
Therefore, Andurand will let investors opt for a new fund which will have the same positions – but size them differently with different risk management. It might average daily 95% VaR of 2.5% and will not be automatically forced to reduce risk upon drawdowns. This answers a reverse enquiry from one investor, and a number of others have warmed to the idea, while some prefer to stick with the existing fund.
Investors can now dial up – or down – to three different risk management targets by selecting or switching between vehicles. The Irish ICAV UCITS runs 50% of the risk of the offshore fund, and the new fund will, on average, run somewhat higher risk than the offshore fund. Investors who switch among any of the funds will be able to carry their high-water marks over to the new vehicle. This relatively unusual commitment is a long-standing hallmark of Andurand’s relationships with investors: BlueGold investors who switched into Andurand also did so, and therefore did not pay performance fees on their recovery of their individual BlueGold drawdowns. Historically, a drawdown has been an opportune moment to take a view on Andurand’s energy trading acumen.
We expect demand growth of 1.5 million bpd in 2019, and 1.7 million bpd in 2020.
Pierre Andurand
2018 in perspective
Andurand’s drawdown in 2018 also needs to be set against the longer term perspective of his hit rate on the core trade type – making directional calls on crude oil prices. Since 2004, Andurand has correctly called nearly all of the big moves, and captured a high proportion of them. For instance, he rode oil up to USD 140 in mid-2008 before reversing to short in late 2008 and 2009. He was also long from 40 to 120 between 2009 and 2011, and short from 120 all the way back down to 40 and below between late 2014 and early 2016.
The two key fundamental culprits of the 2018 loss were the US U-turn on Iran sanctions, and the US production overshoot. “We had expected oil to make a parabolic upside move of the type seen once every 5, 7 or ten years and reach USD 100 or 200, due to the sanctions. The market did the opposite as the Saudis had increased production to compensate for the Iran sanctions, and were taken by surprise when Trump waived 95% of the sanctions. Refiners then realized they would get waivers and did not need to buy the crude. In addition, US production came in about 1 million barrels above expectations,” he says.
These fundamental factors were then amplified by more technical factors, “such as CTAs moving from maximum net long to maximum net short, and option related activity whereby negative gamma kicked in for those who had sold puts to producers, and had to buy back the puts on the way down,” he continues.
Fundamental analysis
Andurand believes that the market plunged well below what was warranted by fundamentals in late 2018. He remains broadly constructive on the medium to long term outlook for oil prices. Multiple factors are throwing up positive signals.
Andurand traded physical oil as a proprietary trader and continues to monitor the physical markets, even though they are not traded in any of the current funds. “Physical market signals are very strong. Every physical grade is strong: we look at West Africa, Angola, Nigeria, the US MAS and LLS, the Gulf Coast, Permian basis, Dubai, Oman, the North Sea, and the Urals in Russia,” he says.
Demand
“Demand growth of 1.7 million bpd remains above expectations and there has been no slowdown in the growth of oil demand, which should continue to grow absent a global economic crisis: it has grown by 1.5 million bpd (plus or minus 300,000) every year of the past ten bar 2008. We expect demand growth of 1.5 million bpd in 2019, and 1.7 million bpd in 2020.” Would a China hard landing threaten this thesis? “Oil demand growth in China has also been steady around 300,000 bpd and is not particularly sensitive to the country’s growth rate. Whereas base metals and cement used to build infrastructure are sensitive to economic growth, oil is more about moving around existing infrastructure. A mild US recession need not choke off demand either, it would need to be a real crisis.”
Supply
On US production, Andurand tentatively ventures that the pace of increase might have slowed down and his projection is now close to consensus in expecting perhaps a 1.3 million increase. But he is cautious that the US data is choppy.
His biggest non-consensus view remains projections of a decline in non-OPEC, ex-US production. “This could bring a structural bull market by 2020-2021 even with strong US growth. Norway’s production is already declining. Some analysts have revised down their forecasts of non-OPEC ex-US supply by as much as 7 million barrels over the past few years.” Non-OPEC ex-US has underinvested to the tune of $1 trillion versus the historical trend, and this has to take its toll. In the near term, producers have squeezed more out of brownfield production but this increase of brownfield production just depletes reserves faster and ultimately will lead to faster production declines.
Discoveries of new oil fields in Guyana could be transformational for the local economy, but in the wider scheme of things, 200,000 bpd is not going to move the needle of global supply. “In fact the world has been so well explored that any chart of new discoveries has been in decline since 1965 and has been near zero in recent years.”
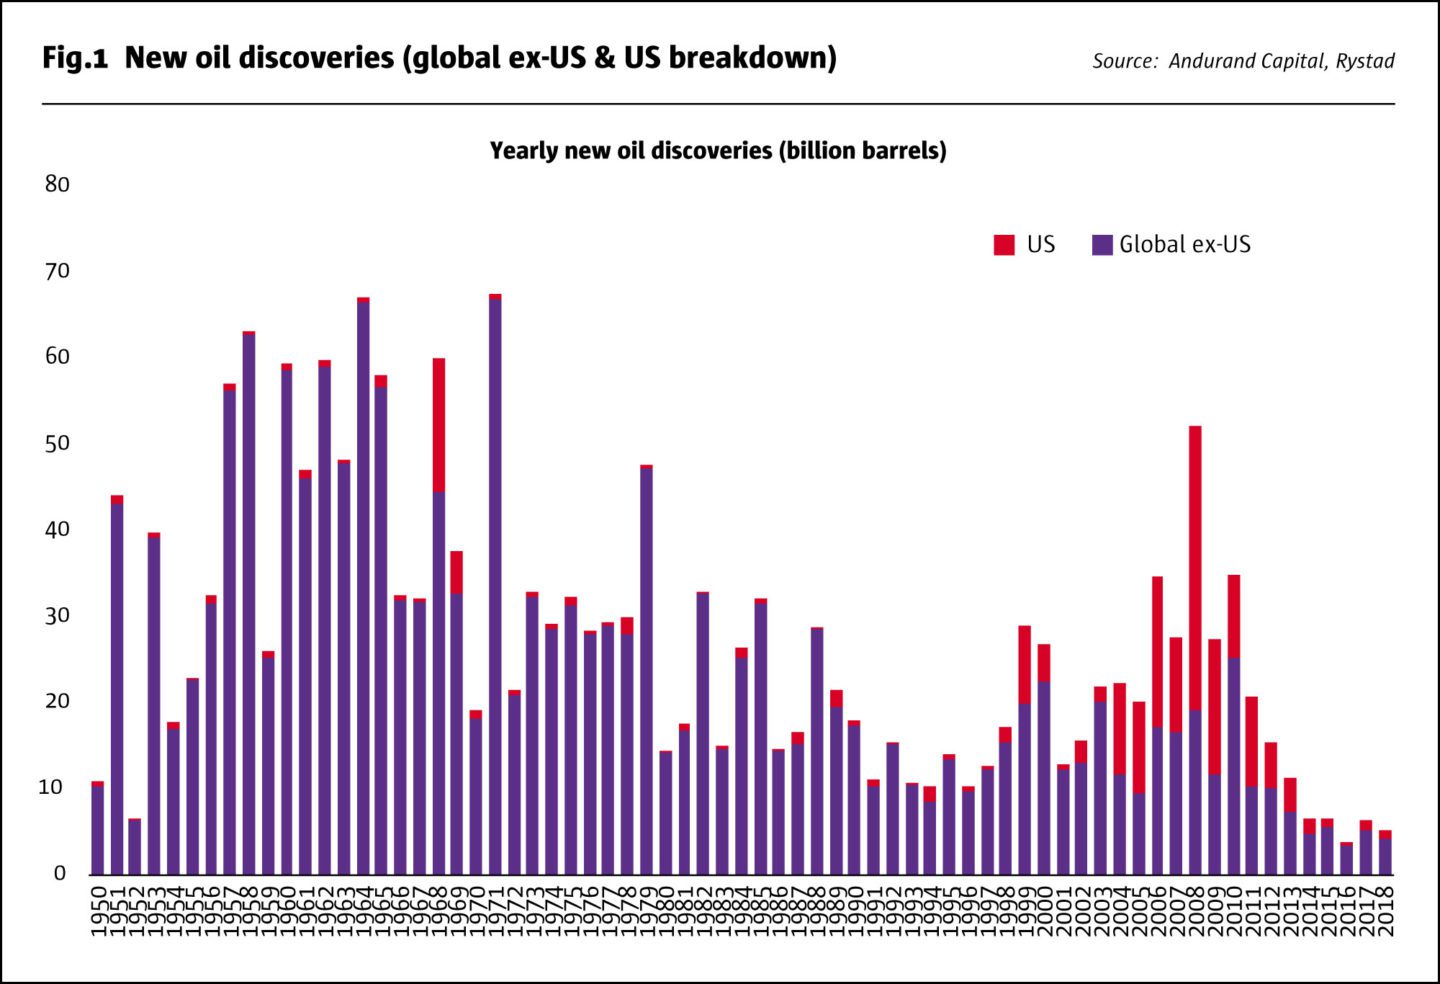
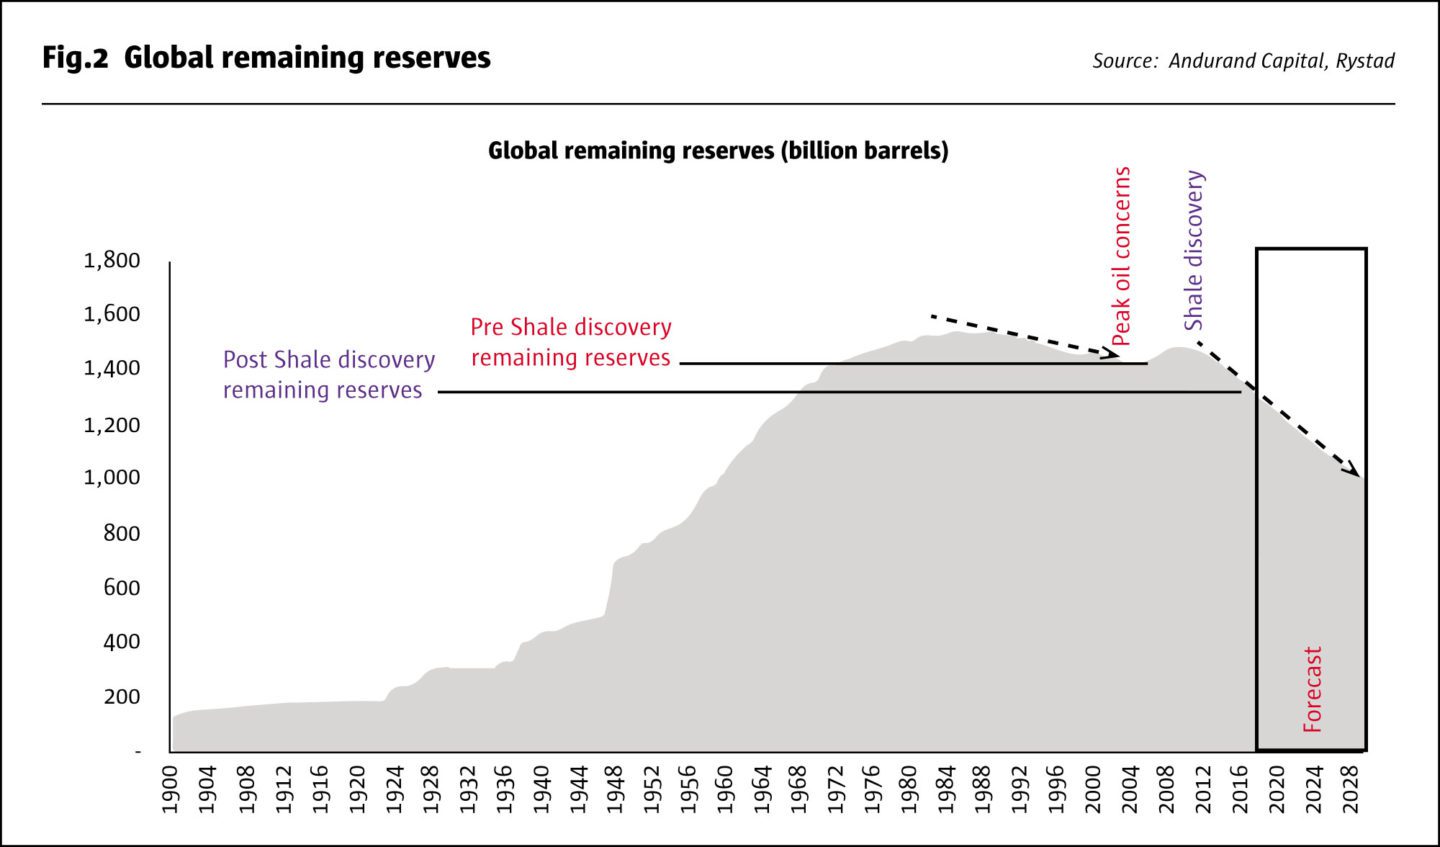
“With the exception of US shale, less oil is being found despite new technology and exploration activity. I continue to be surprised that shale companies can easily raise capital when they have had negative FCF of USD 350 billion over the past decade. Nonetheless, I do not expect US growth can fill the expected gap from non-OPEC ex-US production declining. Environmental concerns that have prevented drilling in some regions, such as Norway, could contribute to the shortfall. Overall, remaining reserves are dwindling.
“OPEC Plus – including Russia and Kazakhstan – has cut output and compliance is very good. The Saudis cannot officially state their oil price target but they want USD 85 or more, and will not raise output for fear of repeating the 2018 plunge. Some smaller countries may be cheating but the amounts are small,” he adds.
Key swing factors for the supply outlook include Venezuela, Iran and Libya. Venezuelan supply is down and Andurand struggles to foresee a scenario that could change matters. “Venezuela is in a state of chaos, with no money, food, security, or medicine. It is hard to plan, organise and grow production. The base case is that it will keep on disappointing and go lower, to below 1 million or even 0.5 million or even near zero. The US does not want to send troops in and anyway it took Iraq many years for production to recover.” In Venezuela, the base case is a 400,000 loss on sanctions, the bull case is no recovery, and the bear case is a smooth regime change. Iran is something of a wild card because “we cannot take Trump at face value. He has a very short-term focus. Regime change is not impossible, but is unlikely.” For instance, the base case for Iran is 300,000 barrel reduction; the bull case sees a roll back of waivers cut this by 20-40%, and the bear case would involve a US deal for increases. The base case for Libya is stable production of 1 million barrels per day, but this could come down if the civil war escalates. Risks in Nigeria include militant attacks.
This year’s data has given Andurand more confidence in his bullish thesis: inventories in the first quarter of 2019 came in about one million barrels below expectations. As the first quarter normally sees low seasonal demand, Andurand had expected a build of 800,000, so was surprised by a draw of 200,000. (Incidentally, sales from the US Strategic Petroleum Reserve are a red herring here: “the US has been selling it down for the last 30 years and does not need such a large SPR now it is a net exporter,” he says.)
Technicals
Technical factors around market participants’ positioning are also watched. Producer and airline hedging activity is monitored partly through the commercial position in the Commitment of Traders report while big hedging programs from Mexico and Petrobras are also looked at.
What is most relevant at present is that backwardation has reached fairly steep levels, close to the highs of early October 2018, and Andurand expects the market to stay backwardated. This is a positive factor because a positive roll yield of 4% from backwardation makes the market more attractive to CTAs and macro funds. However, Andurand is not sure that macro funds are yet paying much attention to oil, as they focus more on the US/China trade war, weak EU data, fears of a hard Brexit, and yield curve inversion. This could mean they have dry powder and will get lured in later on.
Bunker fuel regulations relative value opportunity
Andurand only takes a directional position when he has high conviction – there have been extended periods of a year or two when he has no directional position and/or has shifted the focus to relative value trades. Thus he is not totally reliant on making accurate directional calls, and sometimes trades such as Brent versus WTI have been the key return drivers. In April 2019, he has conviction in both the upside for crude and in a selection of relative value trades where crude forms one leg of the trade.
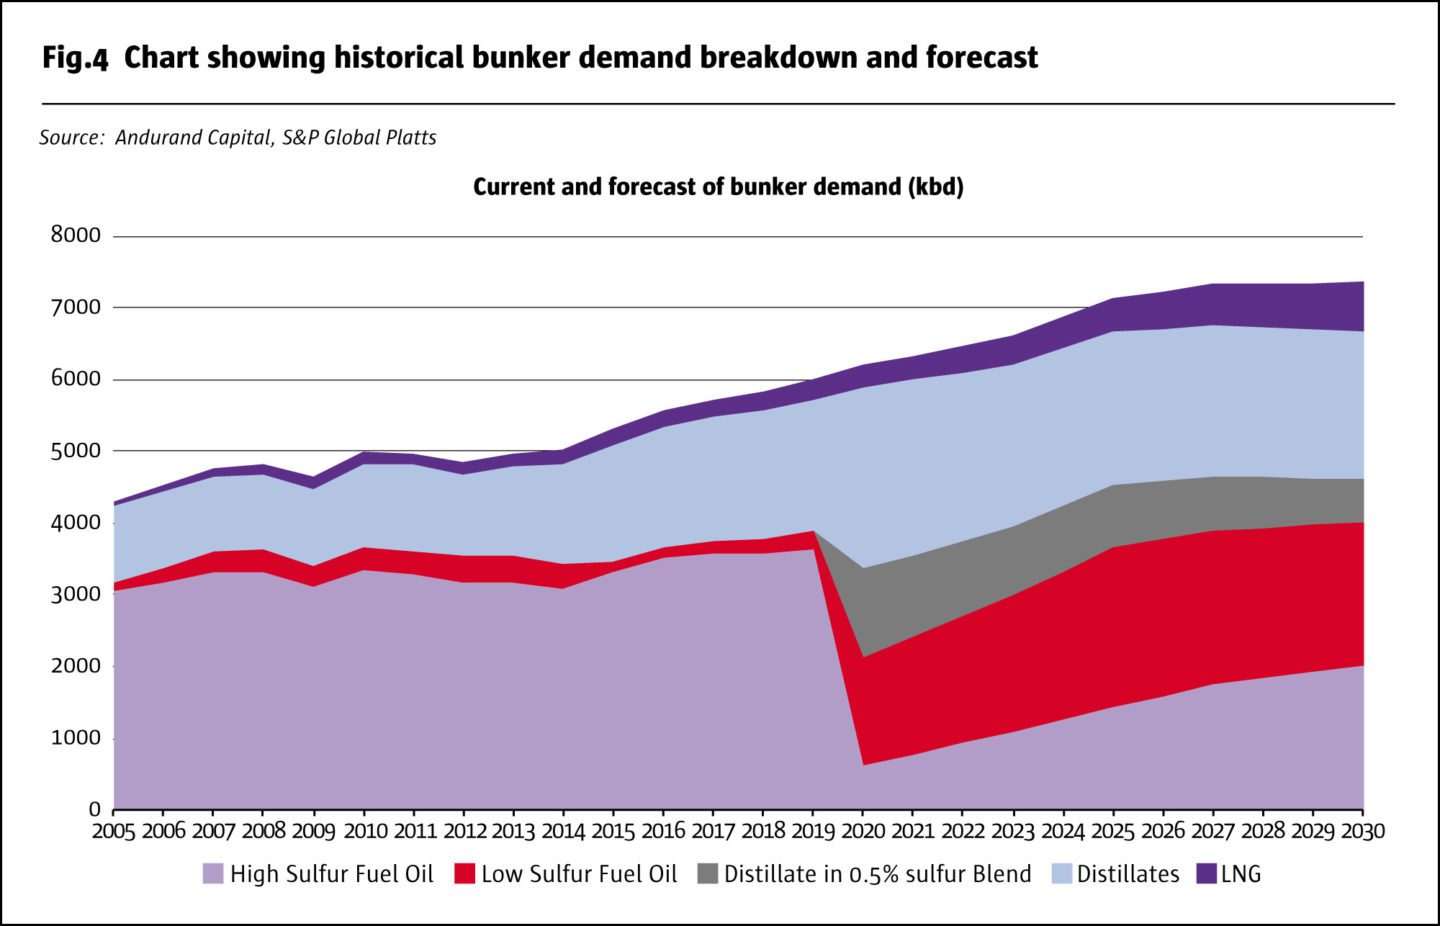
Another force behind the bull case for crude oil in general also provides the rationale for relative value trades inspired by changes in the International Maritime Organisation (IMO) rules on shipping bunker fuel. The new, cleaner and greener, marine fuel regulations for bunker fuel used by ships aim to reduce emissions of sulphur oxide, which contribute to acid rain. The maximum mass by mass sulphur content will be 0.5% from 1 January 2020, a big cut from the current 3.5% for most parts of the world. (Emission Control Areas (ECAs) are already subject to a limit of 0.1%.)
This could shift the demand balance away from heavier, higher sulphur “sour”, crude grades – which make more heavy fuel oil – and towards lighter, lower sulphur “sweet” crude oil – which make more distillates, such as diesel. This underscores the case for being long of crude oil futures, which are based on light crude, because refiners will need to increase utilisation to generate more diesel.
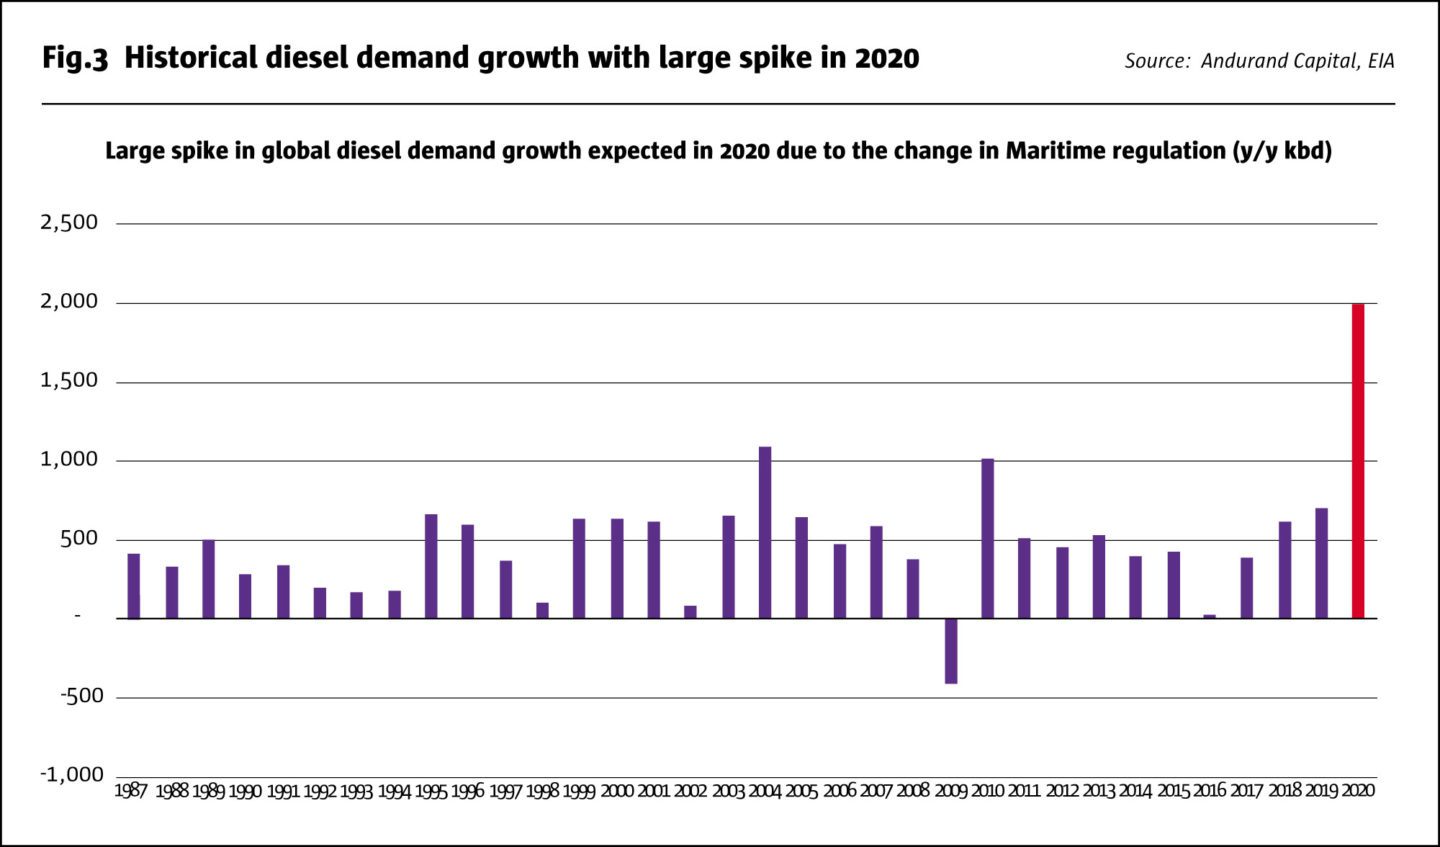
But a more focused way to play this expected rebalancing of demand for different types of oil and oil derivatives is to go long of gasoil and diesel crack spreads, and short of fuel oil crack spreads.
Other factors that support a bull case for gasoil include the very low worldwide inventories of distillates in terms of forward demand cover with most of the world’s demand growth being in distillates. The increase of ultra light sweet production relative to medium sour crude production makes it more difficult to increase distillates’ yields at the refinery gate, which is bullish gasoil.
Furthermore, the IMO regulatory change will lead to an increase in distillates demand as gasoil will have to be blended with high sulphur fuel oil in order to meet the new spec of low sulphur fuel oil. Refiners will do all they can to increase distillates production to meet that demand increase but it will not be easy. They will also do what they can to reduce fuel oil production. It will be a challenge in the first year and as a result, an increase in the gasoil versus fuel spread is warranted.
Regarding positioning, CTAs are not long gasoil (but are long crude and very long gasoline). So despite the bullish thesis on distillates being quite clear, the market is currently not positioned to the upside, which contributes to Andurand perceiving this trade to have a superb, asymmetrical profile.
Andurand started out as a distillates trader, looking at gasoil, diesel and jet fuel and had also traded gasoil when running BlueGold. He has already put on a gasoil crack spread at USD 15 and expects it might rise as high as USD 30 per barrel, but should not narrow by more than a dollar or two. The risk reward ratio is therefore ten to one. The trade uses European gasoil exchange-traded futures, which are cleared.
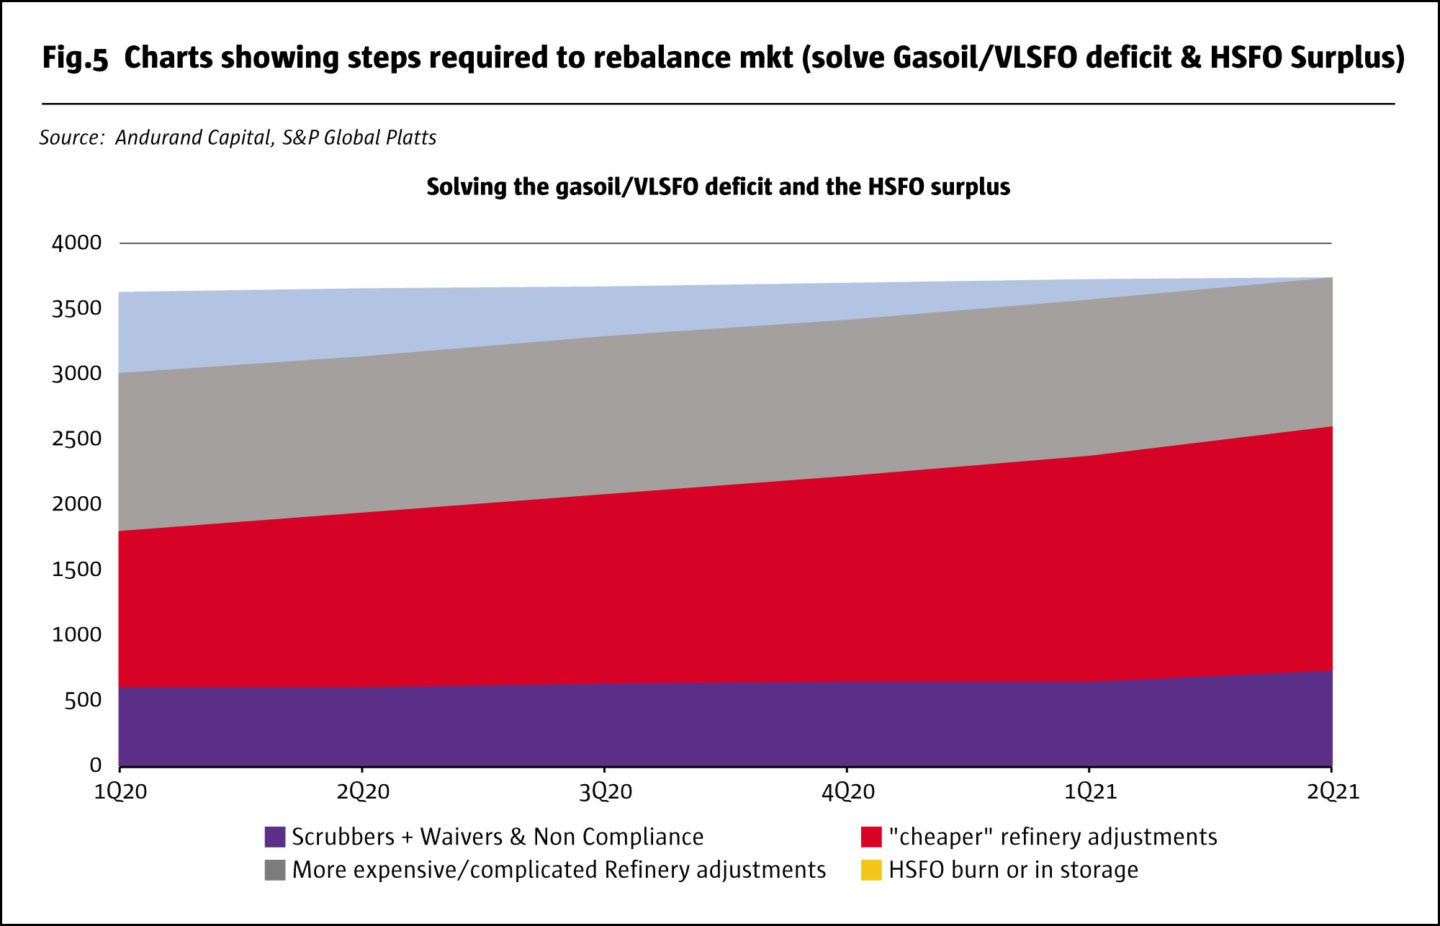
Andurand was not able to increase the size of this trade in April 2019 because he was close to risk limits – but that could change in the new vehicle which provides more freedom over risk levels. (Fig.6)
Andurand Capital has 24 staff with 16 in London and 8 in Malta, where his BlueGold was one of the first hedge funds to establish a presence over a decade ago. He estimates that he could easily run a multiple of current assets, which are c.EUR 800 million, mainly in an offshore fund, with some pari passu managed accounts and the UCITS ICAV. The US-biased investor base is comprised mainly of institutions such as pension funds, insurance companies and endowments, which generally maintain higher portfolio weightings in alternatives, including commodity-related strategies, than do institutions in Europe.
- Explore Categories
- Commentary
- Event
- Manager Writes
- Opinion
- Profile
- Research
- Sponsored Statement
- Technical