
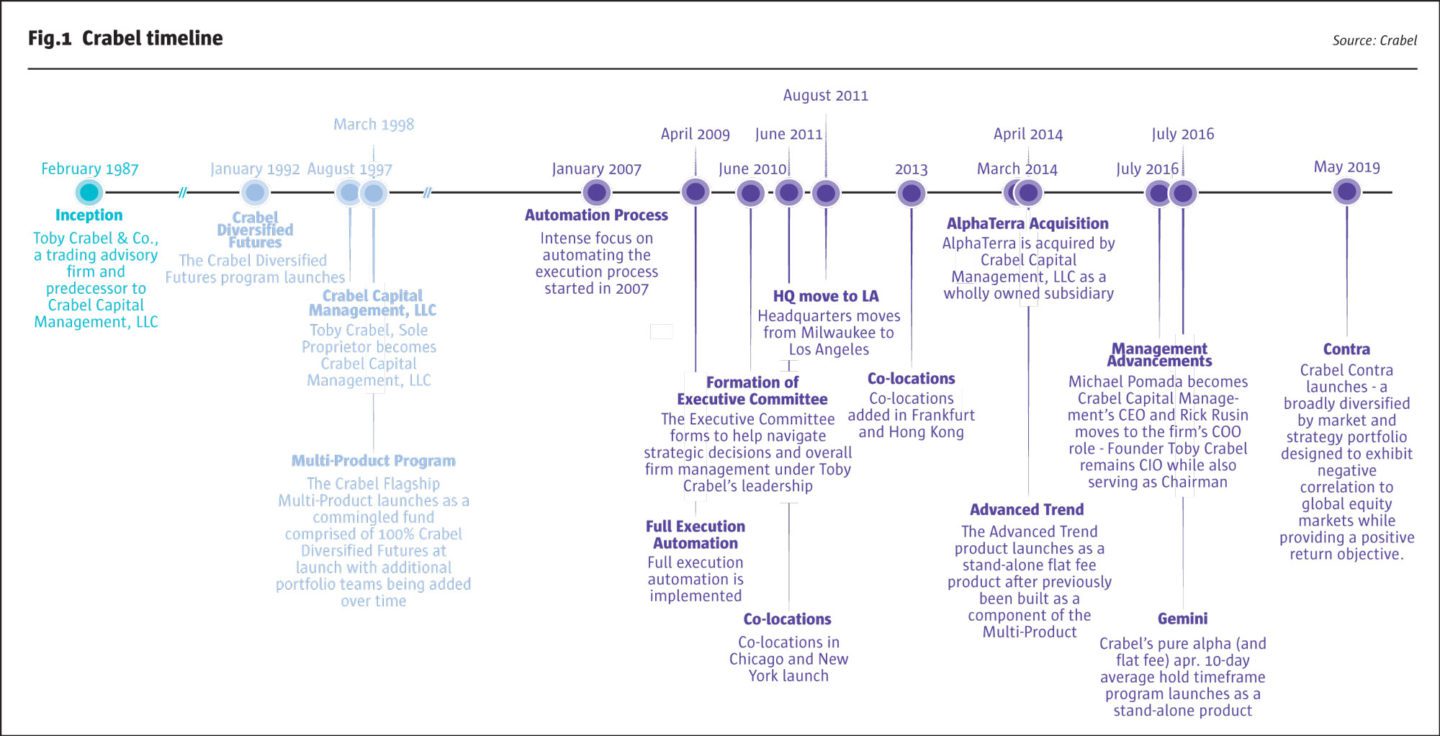
Crabel Capital Management (“Crabel”) is a Los Angeles-based CTA founded by short term trading pioneer, Toby Crabel. The firm has delivered over 25 years of uncorrelated returns for an institutional client base. This year, Crabel has bucked the generally flat trend of hedge fund flows and raised $1bn in the first nine months of 2019, taking total assets to $3.8bn, across three programs: $1.7bn in the flagship, Multi-Product, which is near capacity; $1.2bn in the flat fee Gemini short term trading strategy that The Hedge Fund Journal profiled in 2018, which probably has at least another $1.5bn of capacity; and $800m in the flat fee Advanced Trend strategy, which launched in 2014 and is the most scalable of them all. Crabel has used capital from the flagship strategy to launch a fourth program, Contra, which is its third flat fee offering. Contra can be accessed through managed accounts or Crabel’s commingled funds and in due course will be investible through what will be Crabel’s third UCITS fund on the award-winning MontLake UCITS platform. Crabel Contra targets a 10% annualized standard deviation and the portfolio is off to a strong start returning approximately 6% between May and August during a time when equity markets were flat.
Clients have specifically homed in on the fact that traditional trend following strategies did not profit during the abrupt reversals seen in February and October 2018.
Lisa Martin, Director of Business Development, Crabel
Contra builds on a body of research and trading expertise developed over decades at Crabel. Including techniques such as machine learning and pattern recognition that Contra’s co-PMs, Crabel CEO Michael Pomada and WPD Crabel Director Steve Wisdom, have spent years incubating within the firm. “Toby and I reorganised the research team to remove siloes and create a more collaborative and integrated research environment. That multi-year project has contributed to a wider menu of strategies being offered externally,” says Pomada. Gemini, which launched in 2016, was the first roll out of this IP; Contra uses some of the same concepts as Gemini, but also has its own distinctive DNA, including its own flavour of machine learning. “All of the models in both Gemini and Contra have live, real money trading histories, though the concept of a track record is somewhat different and more fluid for Contra’s machine learning sleeve: the tools and process have been tested, but the precise mix of strategies at any point in time will vary because it is constantly reconstituting and recombining other strategies,” says Wisdom. Some managers are using AI and machine learning techniques in conjunction with growing amounts of alternative and non-traditional data, including more fundamental and unstructured data. Crabel is not a purely technical CTA, but its data feedstocks have not radically changed. “Though there are now some fundamental data inputs, they play a marginal role as signals are generated predominantly from price or price derivative data such as term structure, volatility or yield,” confirms Pomada.
The Contra program tilts its choice of models and markets towards the objective of protecting portfolios from equity market sell-offs. “The genesis of Contra was clients’ concern that the equity bull market is becoming overextended, and their desire for an uncorrelated approach that could profit from a bear market. Clients have specifically homed in on the fact that traditional trend following strategies did not profit during the abrupt reversals seen in February and October 2018, and therefore want a faster moving product that can be a first responder,” says Crabel’s Director of Business Development, Lisa Martin.

(L-R): WPD Crabel Director, Steve Wisdom; Crabel CEO, Michael Pomada.
This is not an easy objective to achieve. Equities have a structural tendency to drift upwards over time and many explicitly long volatility strategies, such as owning put options, shorting credit or shorting other risk premiums, exhibit a high negative carry, time decay or “bleed” cost; for instance, some option buying managers have gone out of business. Some “tail risk” strategies characterised as insurance are designed to lose money most of the time in order to provide big payoffs during crises, but paying insurance premiums is not Contra’s aim.
“Contra’s mission is to provide some degree of predictable downside protection, while also generating all weather returns, including in more benign equity environments. All of the strategies have a positive expected return, based on their historical behaviour,” says Pomada. At the simplest level, Contra blends two families of strategies: one set is volatility-hungry, and the other is intended to profit in all climates. “The volatility-loving sleeves aim to profit from spikes in volatility, but not exclusively via equity markets: they also profit from the way in which other asset classes, such as volatility indices, currencies, bonds, and commodities move during risk-off phases. This is classic Crabel building on Toby Crabel’s pioneering short term trading that goes back to his time working on the floor of a Chicago exchange in the 1990s and the founding of the firm in 1987,” says Wisdom. For instance, the Russian rouble currency might sell off during a flight to safety episode.
Negative correlation
Both the long volatility strategies and some of the all-weather strategies are designed to exhibit negative correlation to equities. “The Contra program targets an average beta to equities of minus 0.4. This will vary but historical testing shows it was negative nearly 100% of the time,” says Pomada. The negative correlation is implemented through both directional positioning in equities and expected cross-market correlations. “Roughly half of the anti-correlation effect is intended to come from equity positioning, and the other half from other markets,” he continues. “Most simply, the overall program is always at least slightly net short of equities. And three of the four strategy families (portfolio protection, machine learning, and opportunistic) will only go long of assets with at least a minus 0.3 correlation to equities, and only short assets with at least a positive 0.3 correlation to equities, while taking no position in assets with correlations in between these boundaries. Correlation plays a further role in portfolio construction via position sizing: assets with the largest negative or positive correlations to equities will be the largest position sizes.” Correlations are calculated using a proprietary correlation matrix.
Benchmarking
The negative correlation qualities influence the choice of benchmark for the strategy. “It should be something like the Société Générale Short-Term Traders’ Index (STTI) or trend-following products with capped or zero equity beta, which have not profited in recent years, when equities contributed the bulk of CTA profits,” says Wisdom. Crabel’s flagship and its Gemini strategies have both outperformed the STTI by a large margin.
Portfolio protection strategy
Only one of the four strategies sounds like a traditional equity portfolio insurance strategy, albeit one expected to profit over time. “Contra’s second largest sleeve – portfolio protection – is explicitly designed to participate in deep down days in a material way. If equities sell off 3-4% in a day, that part of the portfolio should have not just a good day but a great day. The models are faster moving than in the Gemini strategy, so they can latch onto intraday drawdowns. This will throw up some false alarms as well – the strategy will typically predict five out of two crashes,” says Wisdom. “The false positive signals generally result in fairly modest losses. For instance, the portfolio protection strategy has been whipsawed and lost a little in the five months between May and September 2019. It needs some degree of follow-through in a downtrend, which could be intraday, multi-day or multi week. A range-bound, choppy, whipsawing market can be challenging for these models,” he adds.
Machine learning strategy
Contra’s largest strategy allocation is the machine learning sleeve. Crabel was far from the first manager to apply AI and machine learning techniques, and they do not make up 100% of any of its strategies but have generated remarkable alpha. Crabel follows a “supervised” machine learning approach because the manager has found, during the past six years researching machine learning, that a very pure “unsupervised” approach of working with raw data, and “letting the data speak”, was not a failure but did not work particularly well. “Our own machine learning approach, making up around 20% of the flagship strategy, has been a success: generating a Sharpe of 1.5 over the past five years, double that of the parent portfolio from which the strategies were derived,” says Pomada.
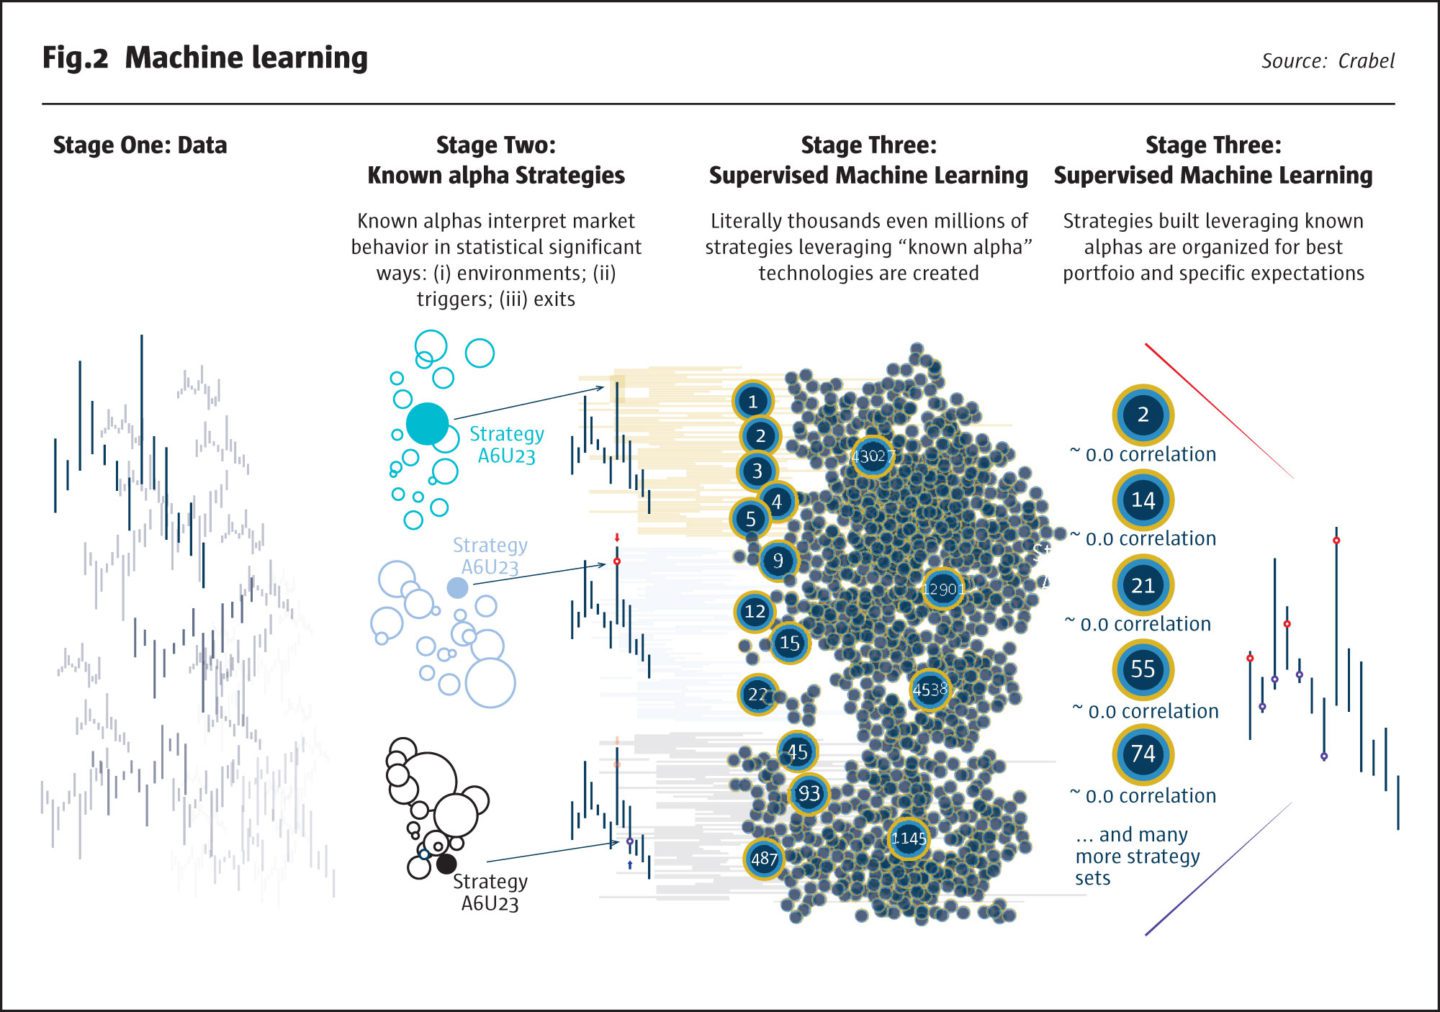
Crabel’s machine learning process starts with humans filtering the alphas and deciding which ones to plug into the model, that does not choose them. The philosophy remains observation and hypothesis-based as it was before Crabel started to explore machine learning: known alphas are statistically significant signals for entering and exiting trades under certain market regimes. Many of the ideas fed into the machine learning engine build on the momentum and mean reversion models that Crabel has honed and refined over the decades, using terabytes of tick level data to test models. The trades pursued in this area could sound quite familiar – such as a price or volatility range breakouts under conducive market conditions – or could be more unfamiliar cocktails of alphas boosted to produce strategies.
“The machine learning approach breaks down strategies into features which are then reconstituted and recombined to regenerate alphas,” explains Pomada. “It also explores the alpha landscape by parameterising and contextualising historical alpha sources. The alphas that we have developed over 25 years are better explored, expressed and expanded through machine learning than by human hand. The research team have identified numerous alpha factors from various short-term strategies, and put them back together so they look very much like the strategies traded, in terms of timing, profit taking, stop losses and so on. This creates a vast library of regenerated trading strategies that are then further honed to produce a portfolio, that has a high expected return and Sharpe ratio, with minimal kurtosis or ‘fat tails’.” (Skewness is not in fact targeted during this optimisation process, but the strategies tend to be positively skewed anyway, partly due to the risk management process.)
Opportunistic/idiosyncratic strategy
The highest overlap with the Gemini strategy is found in the opportunistic bucket, but this is not a pure carve out of Gemini because the markets traded are subject to the equity correlation constraints, and the models traded also have a somewhat bearish bias. “The opportunistic or idiosyncratic strategy uses a subset of directional, relative value and calendar spread models from Gemini, which tend to profit under risk off conditions. This strategy is also dubbed idiosyncratic as many of the models are tailored to specific markets or sectors,” says Wisdom. Links between markets are once again important: the strategy may use behaviour in one asset class as a signal for others.
SALT strategy
The Systematic Asset Leverage Timer (SALT) strategy is the odd one out as it is not hard wired for negative equity correlation at all times, but may sometimes be short of equities. “The SALT strategy seeks to capitalise on structural and behavioural inefficiencies, for instance by profiting from predictable flows that arise from other investors’ portfolio rebalancing in rule-based strategies,” says Wisdom. “Two examples are risk parity managers and trend followers. Unlike the other three strategies, SALT can go long or short of all asset classes: equities, bonds, commodities, and currencies.” He continues, “Crabel is not wading into the debate around risk parity, but rather dispassionately observing the behaviour of other asset managers, who are generally much larger”. Indeed, at least several hundred billion US dollars are managed in products labelled as risk parity, while CTAs run around $300bn, which is still thought to be predominantly in trend following. SALT is designed to perform well under volatile and correlated markets, or under less volatile and more lowly correlated markets; but it can be wrongfooted by some regime changes.
$3.8bn
Crabel has bucked the generally flat trend of hedge fund flows and raised $1bn in the first nine months of 2019, taking total assets to $3.8bn, across three programs.
Variable and opportunistic strategy and market weightings
The four strategy families are lowly correlated and sometimes negatively correlated to one another, and allocations amongst them are not equal weighted. For example, weights were 37% in Machine Learning, 27% in Portfolio Protection, 22% in SALT and 14% in Opportunistic, in August 2019. “Right now, the base case is that this would be a good rough guide to future weightings, but they are a moving target because we are constantly evolving and improving. New alphas and ideas could change allocations,” says Pomada, who expects that model turnover could be 10-15% per year, including both model changes and new alphas.
Strategy weightings can be scaled back due to overriding constraints on position sizes and portfolio stress tests, and sometimes one or more of the strategies can be temporarily switched off. Some CTA managers eschew the use of stop losses, but Crabel uses them because the models may experience alpha decay, get thrown off course by a sudden regime change, or simply lose money during adverse market conditions. Therefore, there are stop losses at position, market and strategy levels and a 2.5% daily stop loss at the overall portfolio level. This works out at roughly a four standard deviation event given annualised volatility of 10% (which translates to daily volatility of circa 0.6% given 260 trading days). The historical simulation does not show any calendar months down more than 4%.
Asset class weightings are also opportunistic rather than equal. In August 2019, equities made up the bulk of risk at 51%, followed by fixed income at 29%, commodities at 12% and foreign exchange at 8%. These proportions can move around but are expected to remain fairly close to such levels. In common with the flagship and Gemini, Contra’s target capacity allows for some smaller markets, including some commodities, emerging market equity indices and emerging market currencies, to be meaningful position sizes.
Capacity
Contra’s investment universe of over 200 candidate markets is the same as Gemini’s, but Contra is more selective due to its correlation band criteria and therefore is unlikely to be invested in all 200 markets at any point in time. But Contra’s capacity is thought to match Gemini’s at circa $3bn as some factors that might result in lower capacity for Contra are counterbalanced by others that increase its capacity. “While the shorter average holding periods (seven days versus ten for Gemini) and a higher degree of intraday trading in Contra (Gemini excludes trade time frames below two days) are factors reducing Contra’s capacity, its smaller average position sizes increase its capacity. Position sizes are smaller because they are sized inversely to volatility – and therefore smaller during bearish volatility spikes, and because Contra’s active positioning is in fewer markets and therefore less diversified.” Contra trades 5,000-6,000 round turns per million against approximately 4,000 for Gemini. (The flagship Multi-Product has less total capacity than either Contra or Gemini partly because its average holding period is one day and it trades 15,000 round turns per million.)
Execution efficiency and fees
Across all programs, Crabel trades circa 60m futures and FX contracts per year globally and pays a lot of attention to execution efficiency. Crabel’s trade execution has been fully automated since 2009 with substantial investment in technology. “We estimate that execution efficiency on our trend following programme is between five and ten times better than the average trend follower,” says Pomada. Slippage is reduced by both colocation and OTC currency execution. Crabel has invested tens of millions in execution infrastructure including co-location in four locations: Chicago and New York since 2011, with Hong Kong and Frankfurt added in 2013. Some 99% of order flow is transmitted via STP, direct to exchanges, with latency of 15 microseconds. Shopping around for mainly OTC currency execution, trading directly with 30 FX liquidity providers, including banks, ECNs and exchanges, can also save on execution costs in FX. But Crabel is quite frank that slippage is only one dimension of trading costs, which also include exchange fees, NFA fees, clearing fees and give-up fees in managed accounts. These non-fee costs are a given for futures trading strategies, but Crabel aims to offer competitive fees.
In common with Gemini, Contra charges a flat fee of 2% (both offer a lower fee for the “early bird” founders’ class), and no performance fee. “We think that 2 and 0 is a fair, reasonable price, as the mutual fundisation of the hedge fund industry is only in its middle innings. We are priced at the lower end of the range but feel that fee pressure is not over. Pension funds need to be able to defend the allocation to their boards. Our Advanced Trend program charges even lower fees of 1 and 0, which is very low by historical standards for an alpha-oriented trend follower. Gone are the days of 2 and 20,” argues Pomada.
Contra’s fee structure marks a break with the history of the CTA industry, but Crabel clearly has sincere ambitions to restore the “crisis alpha” quality that investors have sought from CTAs over the decades.
- Explore Categories
- Commentary
- Event
- Manager Writes
- Opinion
- Profile
- Research
- Sponsored Statement
- Technical