Kaiser, which has offices in Melbourne and London, returned 10.28% for its Kaiser Global Diversified Program’s Class A in 2016, a year when the average CTA was slightly down (the SG CTA index ended 2.86% lower). This disconnect is not unusual: the programme has a low correlation with the BarclayHedge BTOP50 index, with an average historical correlation of 0.3.
“We trade over different time frames, which provides a sound reason for our low correlation,” explains founder Tony Kaiser. The programme’s median holding period is three days, hence the SG Short Term Traders Index – up 0.31% in 2016 – is is another benchmark, which could complement broader CTA indices that can include long-term, medium-term and short-term technical CTAs, not to mention some systematic and quant macro funds that use fundamental data. Indeed, Kaiser’s peer group CTAs are sometimes defined as other short-term traders, such as Amplitude, Boronia (also headquartered in Australia), Crabel, R.G. Niederhoeffer and QuantMetrics.
This does not imply that Kaiser has a similar return pattern to these managers, however. Correlations within the short-term trader universe are lower than the coefficients between medium- and long-term CTAs. As well as ploughing their own return profiles, short-term traders tend to pursue differentiated approaches, in terms of philosophy, process, execution techniques and risk management. Here we outline some of Kaiser’s distinguishing features.
Many CTAs build models. Those that are agnostic in predicting when particular models will perform will always keep all models switched on, while others “time alpha” by switching between and rotating around models. Kaiser is in the former camp and argues that “models are almost irrelevant because they only perform if the market regime suits the model.” The programme’s core focus is “identifying market regimes, states and drivers,” says Kaiser. This provides a multi-resolution understanding of time series, which provide context when entering and exiting trades.
Behavioural finance inspiration
The roots of this approach date backto 1986-1998: Kaiser’s more than a decade in charge of the discretionary FX options desk for what was then Australia’s largest bank, National Australia Bank. Kaiser was intrigued by hedge fund managers and one chapter in Jack Schwager’s book Market Wizards left a particularly strong impression on him. Psychologist Dr. Van Tharp was of the opinion that most people trading in financial markets were delusional. This resonated with Kaiser, who observed how “most people overreact after an event but once a market has moved for a certain period and extent, it is likely to go into corrective zone.” Conversely: “When markets are congested people expect them to stay there forever,” he says. This read across to the options book that Kaiser ran and yielded similar insights. “After a big move people paid up for option premiums but that is the best time to sell options, whereas after no moves they gave away options which was the best time to buy,” he recalls. Thus Kaiser profited from the manic-depressive patterns of other market participants, drawing inspiration from behavioural finance.
Though the seminal behavioural finance papers were authored in the 1970s, the concept did not start moving into mainstream academic finance until the 1990s, when it dovetailed well with Kaiser’s personal experience. “I quantified and proved my theoretical edge, which in turn indicated how much risk to take,” he explains. Though Kaiser no longer trades options, systematising the bipolar behaviour of markets is a key tenet of the firm’s approach.
The process of codifying observed market biases began in 1995 inside NAB, where Kaiser hired Dr. Ewa Swierczak, who is now his Executive Director of Investment Management. Kaiser hypothesised that a good trader should be able to turn his or her hand to any asset class or time series – not just FX options. Limitations in computer hardware and software tooling available at the time meant that proving this theory was no mean feat. But Kaiser’s intuition turned out to be correct, and the models did work across all asset classes. He initially wanted to roll out the programme within the bank, applying it to overlays being run for local pension funds. However, the project ran into resistance within the bank.
Kaiser soon realised that he would need to strike out alone in order to fulfil the aspiration to run his own money in his own way. Upon leaving the bank in 1998, Kaiser hired a Russian atomic physicist, and started trading with his own capital before forming Kaiser’s corporate entity in 1999. The first client was a large European investment bank’s proprietary capital, the second was its directors’ personal capital, and then came inflows from its asset management group. A large local bank came on board shortly afterward and then things went from strength to strength, initially through word of mouth. Once Kaiser was registered with the National Futures Association (NFA) and had a five-year track record, the programme got onto the radar of databases and prime broker capital introduction teams.
Kaiser re-hired Dr. Swierczak and recalls being asked to speak at an educational event in 2003, held in Bordeaux by Carr Futures, marking the start of a long relationship that continues today. Kaiser had used both Calyon and Fimat as the firm’s assets doubled between 2003 and 2010 and recalls, “They were the two best cap intro shops.” Along the way, Carr Futures became Calyon, which, together with Fimat, was subsumed into Newedge, which is now of course Societe Generale Prime Services (SGPS). Today, SGPS and UBS are used for prime brokerage and clearing.
Evolve to survive
The evolution of Kaiser’s investment process hasaccelerated over time. The new millennium brought one notable change. At that time Kaiser was mainly trading volatility breakouts and range-bound markets, and mid-1999 proved to be a challenging phase for the programme. Consequently, in 2000 Kaiser introduced a volatility filter. 2009 marked a more radical rethink still, as the industry grappled with some of its hardest headwinds. Though Kaiser’s loss was only 6% – and this was less than some other CTAs – it came as a shock. This was the first losing year of Kaiser’s near 30-year trading career, including both his prop trading inside NAB and the programme.
In hindsight, Kaiser reflects that “I was probably naïve to have never expected a losing year” – and this seems sensible. Statistically, given the programme’s average return of 8.6% and standard deviation of 11.6% since inception, the 2009 loss was only just above a one-standard-deviation event, assuming a normal distribution (and probably not more than a two-standard-deviation event given Kaiser’s positively skewed distribution).
Nonetheless, 2009 galvanised Kaiser’s team into a reflective mindset of “soul searching, researching adaptive market regimes, and [finding] what drives performance in models and markets,” he recalls.
Kaiser does not rely on any external research, and its proprietary Kaiser Research Application (KRA) has been used to develop the programme. Kaiser’s 15 research and development staff span a broad spread of STEM (science, technology, engineering and mathematics) disciplines. They have studied, many to Ph.D. level and beyond, subjects including pure mathematics, statistical mechanics, electrical and information engineering, artificial intelligence and computer science, with some of them publishing papers in referenced academic journals. But practical research is the route to success with Kaiser. New models have been back-tested over periods of up to 65 years. The testing periods vary with the periodicity of available data. “Daily data goes back to the 1950s, minute data back to 2000, and orderbook tick-and-quote data back for five years,” Kaiser says.
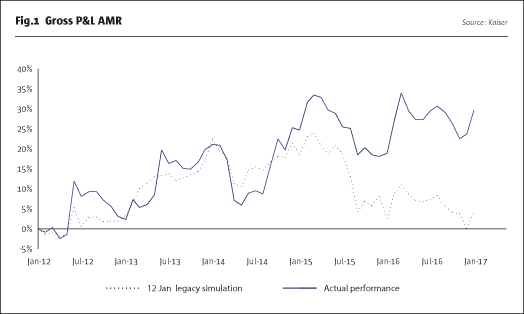
It took several years for Kaiser to get comfortable with the robustness of new models, and the changes set in motion in 2012 should not be underestimated. Had the programme stuck with legacy models, it would not have made any money at all since 2012, according to Kaiser’s simulation exercise (shown above). The chart isolates the impact of changes in Kaiser’s investment models; we will touch on trade execution separately below.
As an aside, if returns are defined as a spread over risk-free rates, the returns of around 22% or 4% annualised over this five-year period between 2012 and 2016 have in fact been close to Kaiser’s historical average (and are close to what most institutional investors now expect from hedge funds, according to Preqin surveys). Rebasing returns relative to cash is particularly germane to CTAs as most of them are sitting on cash balances of 80-90%, which earned material amounts of interest before the advent of Zero Interest Rate Policy (ZIRP).
Regime rotation and risk reduction
While some CTAs have diversified by adding fundamental signals, or have started applying discretionary overlays, Kaiser remains 100% technical and 100% systematic – for both investment signals and for vitally important execution. At big-picture level, the new departure has been categorising markets into four regimes: with-trend (long), with-trend (short), counter-trend, and corrective. Clear trends over one or two weeks are the best climate, and with-trend regimes have provided more than 62% of profit attribution, but Kaiser’s definition of – and trading approach to – trending markets differs from that of other managers. Though the post-Trump bond selloff in December 2016 may have been a source of losses forsome medium- to long-term trend followers (depending on their lookback periods), it was categorised as a trend by Kaiser partly because the manager defines trends over days or weeks rather than months. A further nuance is that Kaiser trades some mean reversion models within a trending market. “Most markets move in waves, so they may rally and then pull back,” Kaiser observes.
If trending markets, however measured, are still the best environment, how does Kaiser respond to range-bound markets? Kaiser is now confident in being able to identify these regimes, but still finds them difficult to profit from, as they “tend to be more noisy.” Therefore, the pragmatic response is to “play defence rather than offense. … A whole swathe of models do not trade during these phases,” Kaiser reveals. Kaiser estimates that overall risk could be halved during these episodes.
Additionally, Kaiser’s counter-trend models are designed more to reduce risk than to act as profit centres. Kaiser’s worst drawdown, 14.84% between January and April 2014, is less than some CTAs have experienced, post-crisis. “Different models can hold opposite positions, and the non-trend models smooth out the return profile by dampening volatility and drawdowns, but contribute little to returns,” Kaiser explains. All market regimes have been profitable overall, but the two non-trend regime models – countertrend and corrective – have made up around 38% of programme profits.
Thus part of the portfolio construction process involves creating uncorrelated models that perform favourably in different market regimes. On top of this, Kaiser has multiple layers of controls on correlated trades, at the market, model, and position levels, as well as for markets per model, models per market, etc. “The key is not blowing up so that you live to fight another day,” is Kaiser’s seasoned view.
Kaiser’s investment into risk-reducing models is pertinent to differences of opinion over fee structures. Some allocators have a preference for risk-adjusted fees, which typically involve calibrating management fees to volatility targets. They therefore argue that Kaiser’s standard management fee of 3% is relatively high for historical realised volatility of 11.6%. Kaiser’s riposte is that removing the risk-reducing models could easily double the volatility, without adding to returns, and this would not be desirable for investors. Kaiser’s confidence in his programme is such that the firm has sought to “take the fee equation out of the argument,” Kaiser says, by offering a share class that charges no management fees and a 30% performance fee. Managed accounts are also offered to as many CTA allocators as require them.
Whether the programme is accessed via the fund or managed accounts, Kaiser provides risk aggregation reporting in a number of industry standard formats – MSCI’s RiskMetrics HedgePlatform; BNY Mellon’s HedgeMark Risk Analysis; and the non-commercial Open Protocol Enabling Risk Aggregation, formerly known as OPERA. In addition, Kaiser is confident about customising reporting.
Staying ahead of the execution game
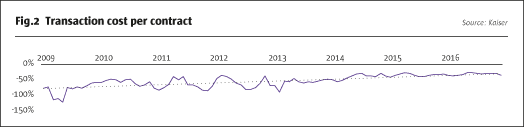
So important is execution that Kaiser has a dedicated team, led by Joshua del Rio, Executive Director of Investment Management, to handle execution and market microstructure. “‘Slippage’, or execution costs, can eat up one-third of the theoretical edge from a model,” Kaiser’s analysis has shown. Though Kaiser is not itself in the high-frequency trading (HFT) space, it is to some extent competing with HFT firms – and is at pains to sidestep “predatory” market participants – when executing trades. Kaiser has invested millions of dollars, and thousands of man-hours, into improving its execution from several angles: the firm has co-located servers,and has refined its models, aggregators and order execution routers. “Execution costs have come down by 40-50% over the past few years and this has added as much as 2% per year to returns,” Kaiser estimates. The firm measures costs per contract traded, by a method known as implementation shortfall. This compares models’ target entry or exit prices with actual prices obtained. In other words, this is slippage versus when the signal was generated. The steady progress in reducing transaction costs is illustrated in Fig.2.
One aspect of the execution programme has telescoped timeframes: co-location with servers in Chicago, Hong Kong and London. The time taken to execute is now sub-millisecond, down from one or two seconds when a trade had to travel from Chicago to Melbourne and back again. Kaiser reckons co-location costs around one million dollars a year, but it took five years for a team of four to build out the data, servers, lines and so on. “It is labour-intensive building software,” he says.
Many hedge funds use one or more vendor packages but Kaiser has developed a suite of proprietary applications to automate multiple functions, which include generating and allocating orders, reporting P&L, monitoring co-location sites, and reconciling trades. Kaiser is now reaping the rewards of this investment. “There are long-term benefits in terms of resource reallocation. Automation reduces the number of people tied up with day-to-day operations, execution, back office, and reconciliation functions, and so pays a research dividend. The execution team is now down from ten to three or four people, who also do research and development,” he says.
Currencies are traded over the counter (OTC), rather than on exchanges. This requires direct connections to individual liquidity providers or ECNs. Kaiser has built an aggregator that collects prices from ten liquidity providers, and claims that “FX slippage is now almost non-existent.” This is partly just about shopping around for better quotes, but is also due to information gleaned from datasets with richer order flow.
Liquidity and capacity
Enhanced execution capabilities bring the added advantages of widening the investment universe and expanding programme capacity. Kaiser has doubled its suite of markets traded to 57, and now estimates capacity could be $3 billion, somewhat ahead of previous peak assets of $2.2 billion; the target gets reviewed at intervals of $500 million. Kaiser says, “Our main criterion for selecting markets is liquidity, and they also need to offer enough volatility to profitably trade.” Kaiser is focused on liquid financial contracts, traded on at least ten exchanges in the Americas, Europe and Asia. Equity indices are the largest allocation and have been the greatest source of profits, followed by bonds and interest rates, with currencies in third place. Commodities provide the highest number of individual markets at 19, but have a small risk allocation due to liquidity, and hence, have contributed least to profits.
All liquid strategies are vulnerable to redemptions and Kaiser has seen asset outflows despite having outperformed many industry peers. Kaiser is far from complacent, reflecting: “When we started 20 years ago our models had great edge but now we ask when and why they will perform.” Kaiser is constantly striving to further improve both investment and execution models and wants to “get back to more consistency in the returns,” he says. At the Managed Funds Association (MFA) and Context conferences held in January and February 2017 in Miami, Kaiser was unveiling advances in placing and adjusting orders, as well as new investment models for trading intraday timeframes.
Kaiser participated in the Australian Securities and Investments Commission (ASIC)’s 2015 survey of the Australian hedge fund industry, published as “Report 439 – Snapshot of the Australian Hedge Fund Sector” on 1 July 2015. The local industry has now surpassed A$100 billion of assets, according to AIMA, which now holds regular events in Sydney and Melbourne. Joshua del Rio serves on the executive committee of AIMA Australia.
Other Australian funds that The Hedge Fund Journal has profiled include Melbourne-based eclectic macro manager AE Capital, and the Blue Sky Dynamic Macro strategy, which is run by Blue Sky Alternative Investments Limited. Meanwhile Merricks’s Capital Manager, Adrian Redlich, was featured in THFJ’s 2014 “Tomorrow’s Titans” survey, sponsored by EY.
We at THFJ continue to find highly differentiated strategies in Australia, which, as the world’s fourth-largest asset management market, should continue to increase its prominence in alternatives.
- Explore Categories
- Commentary
- Event
- Manager Writes
- Opinion
- Profile
- Research
- Sponsored Statement
- Technical