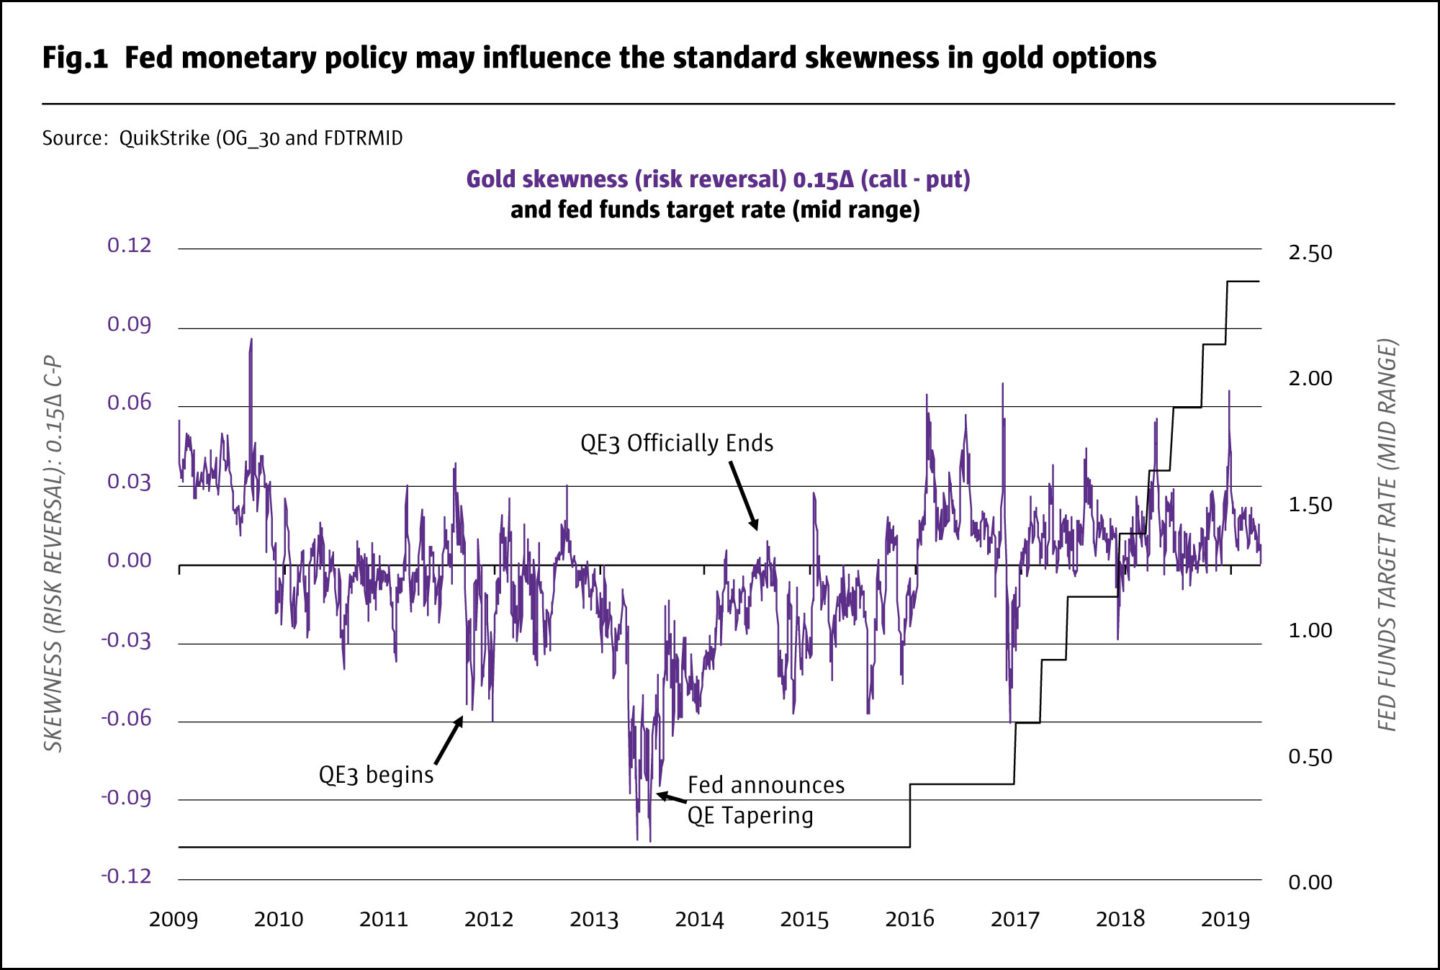
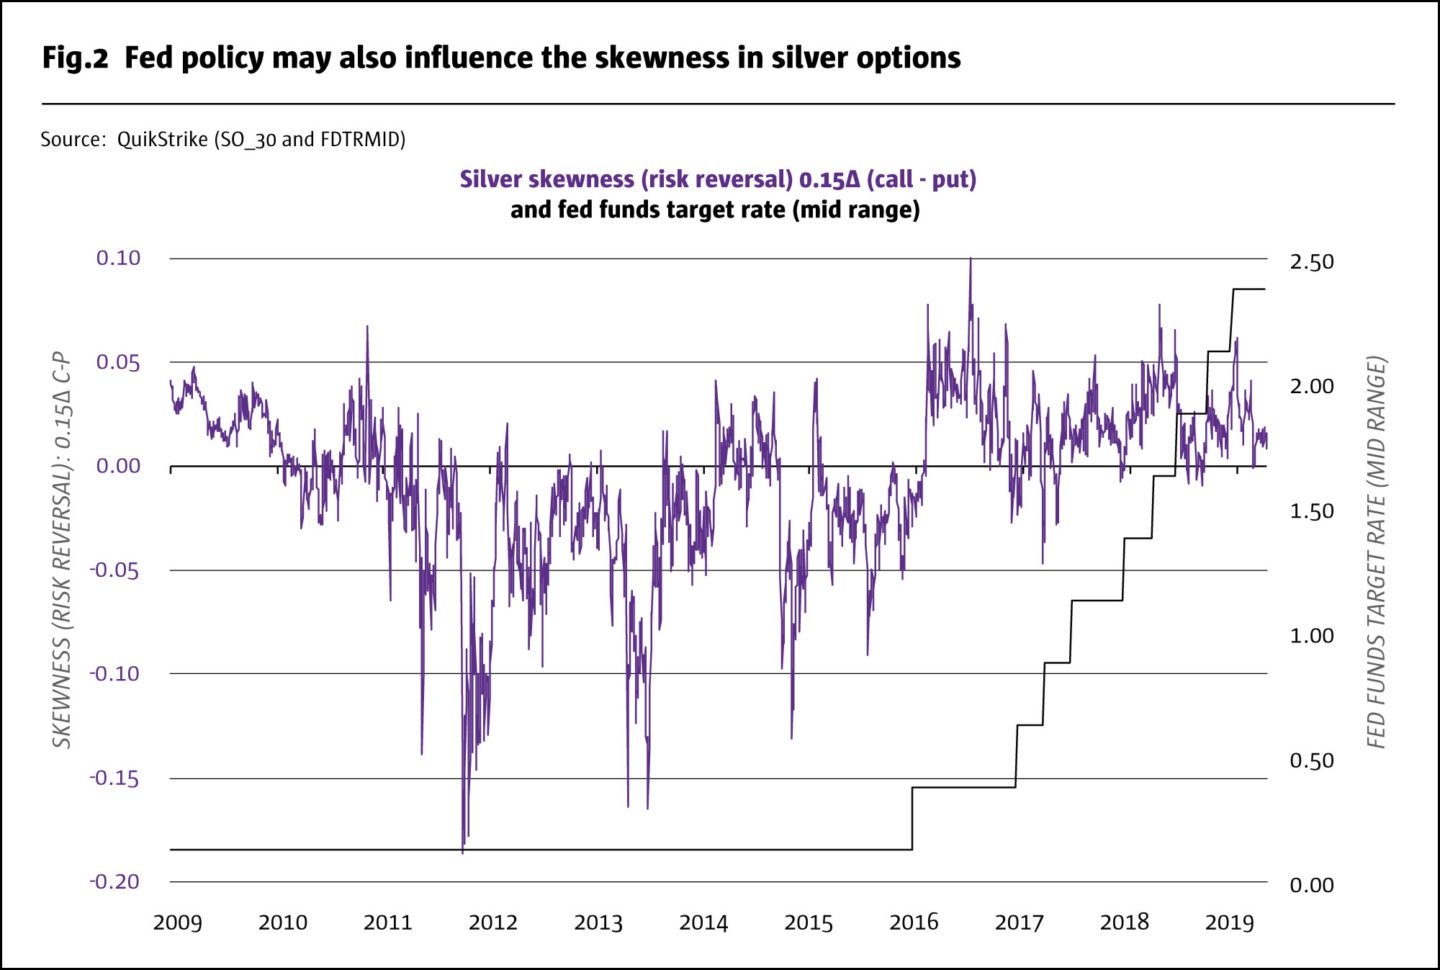
US monetary policy exerts a strong influence on the skewness of currency, gold and silver options. In a normal monetary environment where short-term interest rates are well above zero, investors tend to be more concerned about gold and silver prices rising abruptly than falling. As a result, out-of-the-money (OTM) calls on the metals tend to cost more than OTM puts. By contrast, during the long period of near-zero rates, especially the Federal Reserve’s (Fed) second and third phases of quantitative easing (QE), gold and silver options skewed the opposite way: OTM puts cost more than OTM calls (Fig.1 and 2).
There is a strong analogy that one can draw between the behavior of gold and silver options skewness with respect to monetary policy and that of currency options. As our previous work on the subject has demonstrated (see below), low interest rate currencies tend to exhibit upward skew (OTM calls are more expensive than OTM puts). The opposite tends to be true for higher interest rate currencies. Perhaps this isn’t too surprising given that gold and silver are de facto currencies, though never paying interest. Gold, in particular, has been used as a currency for centuries, and has little industrial use even today. Even fiat currency issuing central banks admit to gold’s role as a store of value by holding large quantities in their reserves.
As the Fed eased policy in 2007 and 2008 and left rates on hold near zero while conducting three successive waves of QE, gold prices soared from $660 to $1,900 per ounce. Silver did even better, quadrupling from $12 to $48 an ounce at its peak. As the metals neared their peaks, the options skew became increasingly neutral as investors became more concerned about downside risks. After hitting their peaks in September 2011, skewness turned negative for several years as investors became concerned about gold and silver’s prospects should the Fed reign in its easy monetary policy.
From 2009 through 2014, the Australian and Canadian currencies also exhibited exceptionally negative options skewness versus the US dollar (USD). Meanwhile, other currencies such as the Japanese yen and Swiss franc which like gold and silver normally skew positively versus the USD, began to show negative or neutral skewness. The reason was simple: when the US rates got close to zero in 2009 and stayed there for many years, the USD became a funding currency. Investors could borrow essentially for free in US markets to fund more lucrative positions elsewhere. Prior to the crisis, Swiss francs and Japanese yen were the primary funding currencies, but with the advent of near-zero rates in the US, the dollar joined the group.
Borrowing in funding currencies has always been precarious. Borrowers in the Japanese yen learned this the hard way in October 1998 as the high-profile American hedge fund Long-Term Capital Management unwound its positions, resulting in the yen soaring 15% versus the USD in two days. The Swiss franc soared in 2011 and again in early 2015 – making life difficult for foreigners who had borrowed in that currency. From 2009 to 2014, the main risk for holders of foreign currencies, gold and silver as well as for borrowers in USD was that the Fed would tighten policy. Indeed, when the Fed announced the tapering of QE in 2013, gold and silver prices crashed as long-term US interest rates soared (the yield on 10-year Treasuries went from 1.38% to 3.05%) and the dollar rallied against most other currencies and gold and silver, whose prices fell in dollar terms.
Now that the Fed has normalized policy, or perhaps even overtightened, investors see the risks to gold and silver skewing mainly to the upside as with options on the yen and franc, which have returned to their status as funding currencies. The main risk now is that the Fed could cut rates and the dollar could begin to weaken. There is, however, another question about gold and silver options skewness: does it provide useful investment signals? As it turns out, the degree of skewness on gold or silver options may, in fact, provide interesting information for investors – even to those who trade only in futures or in the physical commodity.
Precious metals options skewness as an investment signal
Skewness isn’t consistent over time. In addition to its longer-term moves that appear to relate to US monetary policy, there are plenty of short-term ups and downs in gold and silver skewness and sometimes that skewness reaches extreme levels. So, is exceptionally positive skewness a sign that prices are about to head higher or a sign that precious metals are overextended to the upside and about to correct? Likewise, is extremely negative skewness a sign of further downside to come or a sign that gold and silver prices are oversold and about to stage a rally?
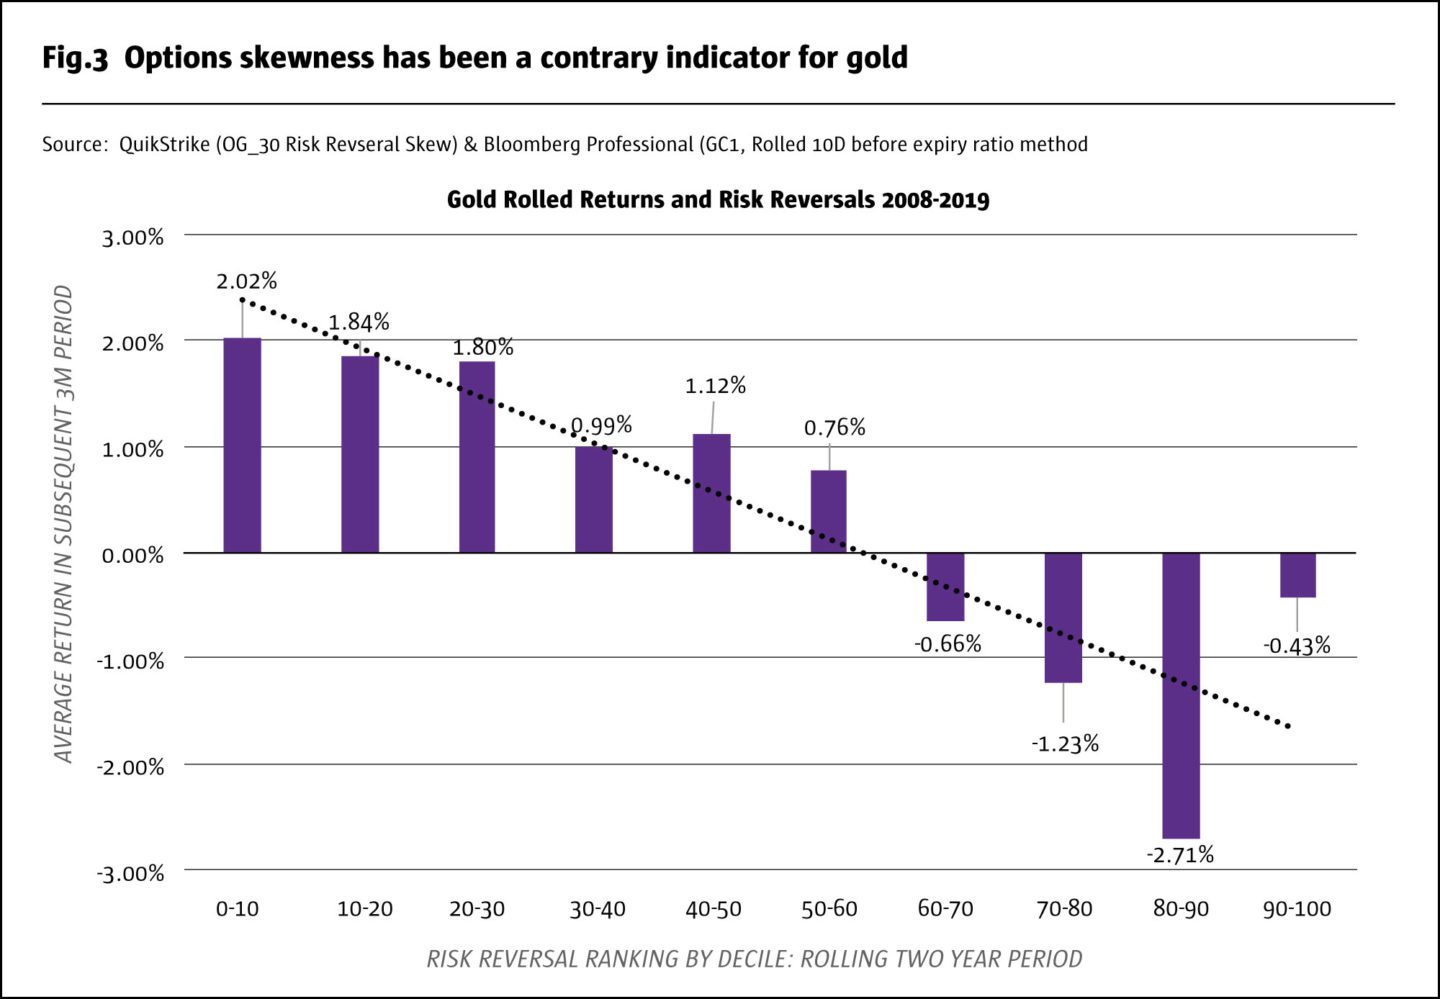
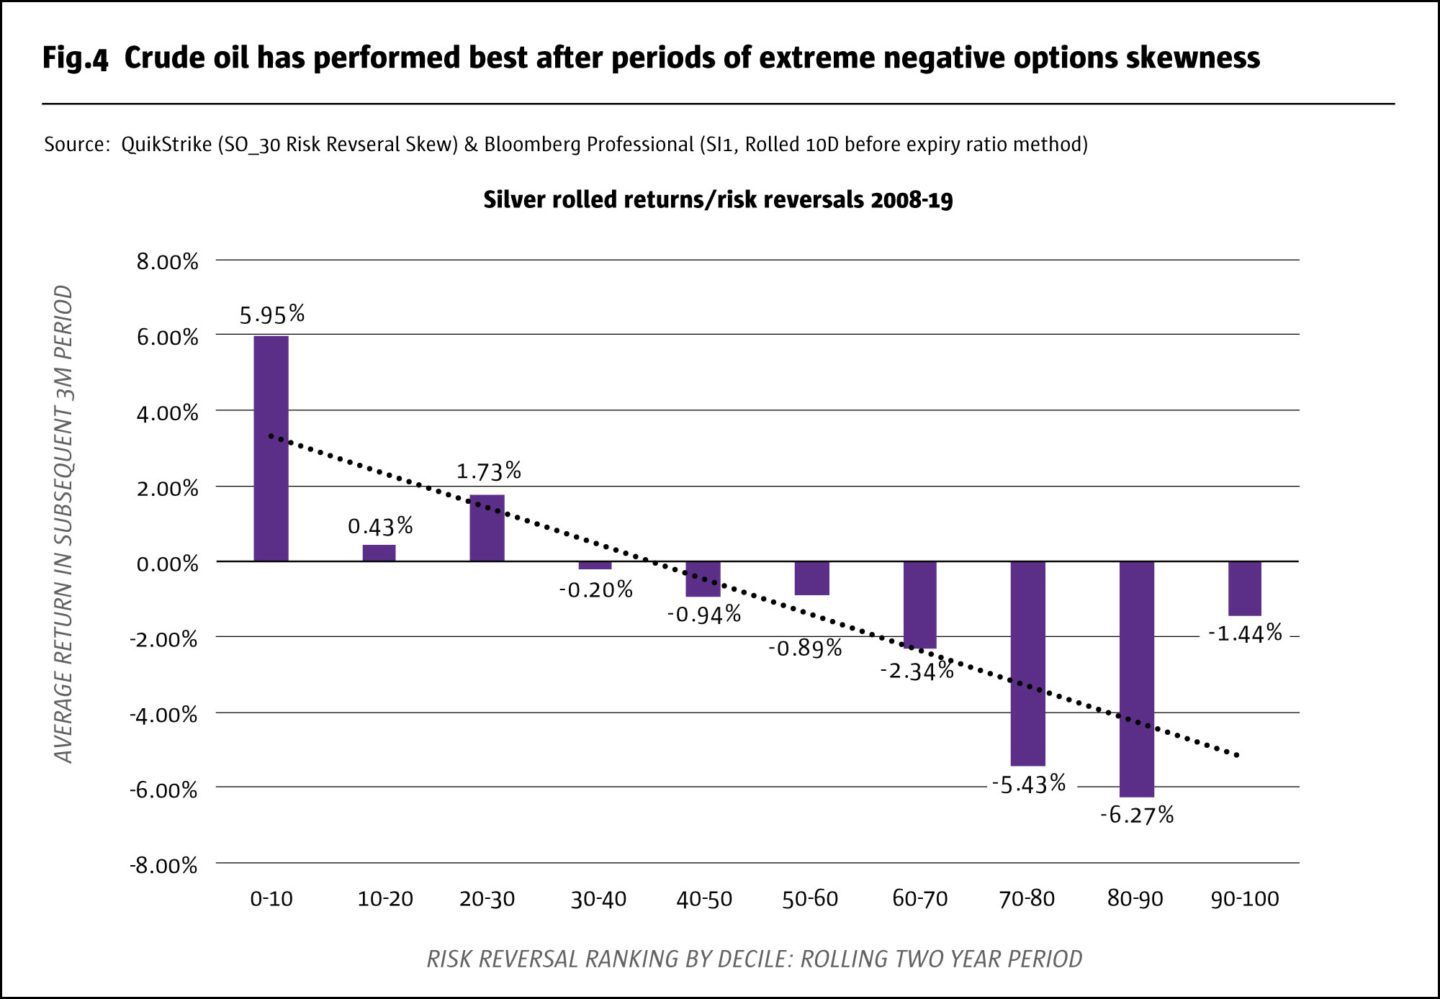
To answer these questions, we indexed the skewness on a scale of 0-100 over rolling two-year periods and compared it to the actual payoff of a fully funded long futures position in the subsequent three months (so there’s no look-ahead bias). For example, if the silver options skewness was the most skewed to the downside it had been during the previous two years, the index would have a reading of zero. If the silver options market was the most positively skewed that it had been during the past two years, the index would have a reading of 100. We then broke the results down into deciles and looked at the subsequent three-month performance of the reinvested future rolled 10 days prior to expiry from 2008 until early 2019.
As it turns out, options skewness has often been a useful contrarian signal. Below-average skewness (OTM puts relatively expensive compared to OTM calls) compared to the previous two years skewness history has often translated into above average returns over the next three months. By contrast, above average skewness (OTM calls abnormally expensive compared to OTM puts) has often been followed by significantly below average returns (Fig.3 and 4).
One should be careful, however, using such information going forward. The results of this study are time dependent and reflect how gold and silver skewness related to subsequent gold and silver price movements between 2008 and April 2019. The relationship between skewness and subsequent price movements could be very different in the future than it has been during the past decade.
Bottom Line
- Gold and silver options skewness varies with Fed policy.
- Near zero rates and QE skewed gold and silver options to the downside.
- Under more normal conditions, gold and silver options tend to skew upwards.
- Skewness has been a decent contrary indicator since 2008 for both metals.
All examples in this report are hypothetical interpretations of situations and are used for explanation purposes only. The views in this report reflect solely those of the authors and not necessarily those of CME Group or its affiliated institutions. This report and the information herein should not be considered investment advice or the results of actual market experience.
- Explore Categories
- Commentary
- Event
- Manager Writes
- Opinion
- Profile
- Research
- Sponsored Statement
- Technical
Commentary
Issue 140
Gold/Silver Options Skews
Upside risk ahead?
Erik Norland, Senior Economist, CME Group
Originally published in the April | May 2019 issue