We recently introduced the Morningstar Style Box for alternative funds, a new research framework for evaluating liquid alternatives investments that will be available to Morningstar Direct clients at the end of October. We first introduced the alternatives style box in our October 2016 paper, which showed how its main components of correlation and volatility can help investors quickly and intuitively gauge a fund’s diversification potential. In this follow-up report, we take a bottom-up look at the alternatives universe by placing each liquid alternative fund into one of the alternatives style box’s nine regions. We find significant diversity among alternative strategies, even among those in the same Morningstar Category, underscoring the potential importance of tools like the alternatives style box for making good comparisons and conducting thorough evaluations.
Key takeaways
- Alternative strategies come in many different varieties, and funds within the same Morningstar Category that pursue very similar strategies can still have very different diversification characteristics. In this paper, we illustrate these features by examining funds that fall into the four corners of the alternatives style box.
- The Morningstar Style Box for alternative funds can help investors more easily make comparisons between funds in different categories and find those with similar diversification attributes.
- Considering both an alternative fund’s correlation and relative volatility to global equities can help an investor set expectations for a strategy and make portfolio-allocation decisions. Setting realistic expectations may also improve investor outcomes by staving off the performance-chasing that often undermines results.
Introduction
Many alternative strategies derive their appeal from the potential to improve a traditional portfolio by further diversifying it, either by delivering an uncorrelated return stream or by dampening volatility and reducing downside. In practice, determining whether an alternative strategy can deliver one or both of those benefits can be a challenge for investors. To make it easier to evaluate the diversification benefits a liquid alternative mutual fund has conferred over time, we created the Morningstar Style Box for alternatives. The alternatives style box plots alternative funds based on correlation and relative volatility to global equities based on the trailing three years of monthly returns. More about the methodology behind the alternatives style box can be found here. Fig.1 shows the positioning of funds in the alternatives style box as of July 2017.
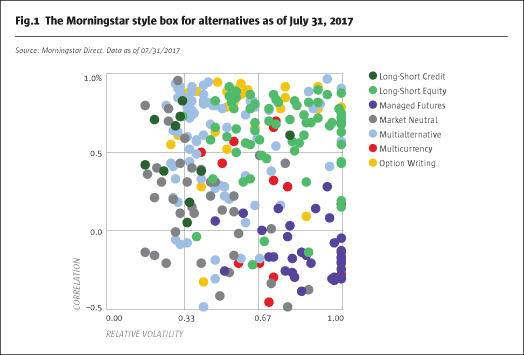
The dispersion of liquid alternative strategies within the alternatives style box is obvious from Fig.1. What’s more striking, however, is the dispersion within each Morningstar Category.
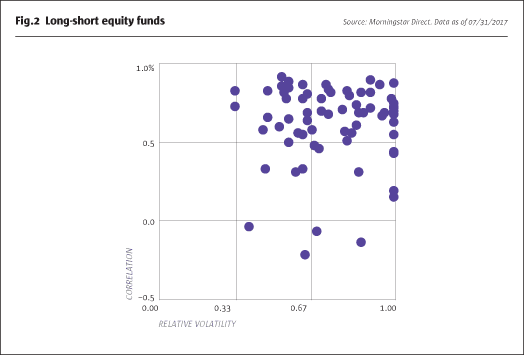
Take the long-short equity Morningstar Category, for example. To be included in that category, funds must invest solely in equities, have at least 20% gross short exposure on a consistent basis, and maintain an equity market beta between 0.3 and 0.8. But within those constraints, there is a lot of room for flexibility, which can lead to a wide range of outcomes over any period. However, these differences appear more plainly when viewed through the alternatives style box, as shown in Fig.2. Using this information, investors can better assess a long/short fund’s diversification characteristics, which facilitates comparison and more-refined analysis.
In this article, we will take a deeper look at the dispersion of funds within each category based on their placement within the alternatives style box using holdings data as of July 2017.
How the alternatives style box can help investors make allocation decisions
The alternatives style box forms along two dimensions. The x-axis depicts a fund’s volatility over the trailing three years compared with that of the Morningstar Global Equity Markets Index. The y-axis measures the correlation to global equities. By plotting funds along both dimensions, we can place them in the appropriate region of the alternatives style box. While this is not a substitute for a complete research process, the alternatives style box can make it easier to detect subtle differences like these between funds using similar investment strategies.
An example can help to illustrate this concept and how investors can use the style box to make more informed decisions on how to use an alternative fund in a traditional portfolio. Take AQR Multi-Strategy Alternative ASAIX and Goldman Sachs Absolute Return Tracker GJRTX, two funds with Morningstar Analyst Ratings of Bronze, in the multialternative category, that seek to outperform broad hedge fund indexes, for example. Despite having similar return goals and volatility levels, the funds have very different diversification characteristics, which investors can easily spot in the alternatives style box. Fig.3 shows where the two funds fall in the alternatives style box as of July 31.
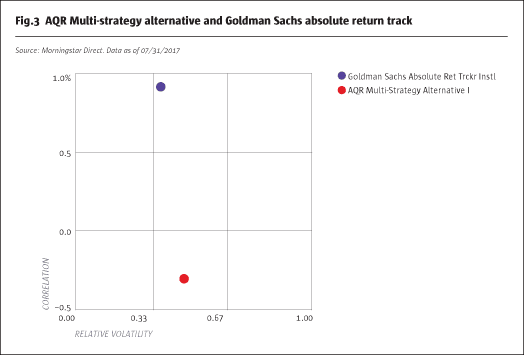
AQR Multi-Strategy Alternative’s management team fully hedges its portfolio of alternative strategies so there is no long bias toward equities. Of course, that doesn’t mean that over short time periods the fund can’t rise or fallat the same time as equities, but it has shown that over longer periods that it does have a low correlation to equity markets. Over the three years ending July 31, its correlation to global equity markets was negative 0.31, which can be observed in the alternatives style box in Fig.3. An investor using the style box can take the negative correlation to mean that the fund’s returns over that period were not driven by equities. In fact, over this three-year period the fund had positive returns when global equity markets were up and when they were down. That doesn’t mean the fund had no risk or suffered no losses, but its returns were largely independent of the direction of global equities. For portfolio construction purposes, AQR Multi-Strategy Alternative shows it can add diversification by delivering returns from sources besides equity exposure.
Goldman Sachs Absolute Return Tracker can benefit a portfolio in a different way. As Fig.3 shows, the fund has a strong correlation to equity markets of 0.90. The fund seeks to replicate the return and risk profile of a broad universe of hedge funds by identifying the factors driving the group’s returns. Since it is trying to replicate hedge fund returns, it will only fully hedge its portfolio against the equity market if hedge funds are. The high correlation signals that the direction of hedge fund returns is being explained by whether equity markets rise or fall. The fund’s low relative volatility indicates it’s only going to move a fraction as much as the stock market, though. So, investors can use the fund to lower the overall volatility of a portfolio by swapping it for equity exposure, but they should still expect the fund to largely follow the path of the stock market. Of course, if lowering portfolio volatility is the only goal, that can be achieved more cheaply by adding additional cash or fixed income to a portfolio. Investors must consider whether the return potential of an alternative fund with a high correlation to equities outweighs the extra risk compared with those alternatives.
Considering relative volatility and downside risk
The alternatives style box not only facilitates comparison of funds, but also gives visual clues into a fund’s downside risk. Given the positive relationship between volatility and downside capture, it stands to reason that as relative volatility—that is, the x-axis of the alternatives style box—increases, so too drawdown potential. Thus, as funds are plotted from left to right across the alternatives style box, the maximum drawdown potential also increases.
To illustrate, Fig.4 shows the average maximum drawdowns for each region of the alternatives style box over the three years ending in July. For comparison, the maximum drawdown of the global equity index was 13.3%.
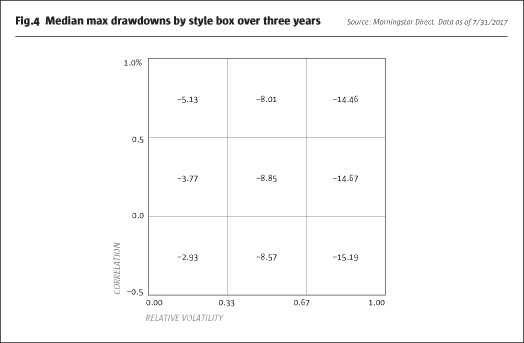
Given the above, it’s apparent that the alternatives style box can make relative risks and potential downside easier to observe and evaluate.
Alternative funds with high-correlation and low relative volatility
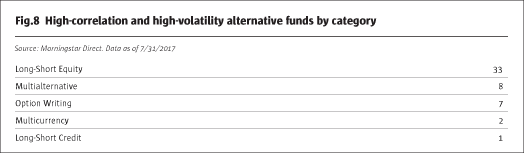
In the top left region of the alternatives style box one finds funds that have a high correlation to global equities (above 0.50 over the trailing three years) and a low relative volatility (less than 33% the volatility of global stocks when measured by monthly standard deviation over the trailing three years). Fig.5 shows the breakdown of funds by Morningstar category as of July 2017.

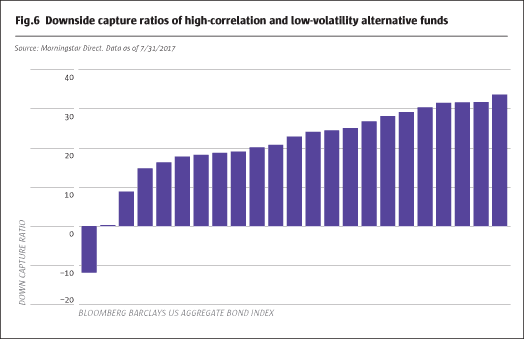
Highly correlated, less-volatile alternative funds are often considered as a partial stand-in for fixed income, which has a similar risk/reward profile. Over the measurement period in this example, the Bloomberg Barclays US Aggregate Bond Index had 27% of the relative volatility of global equities, for instance.
These funds’ high correlation to equities should give investors pause, though, as it indicates performance tends to be influenced by the direction of global stocks. In a market where stocks are falling, these strategies are likely to fall as well, albeit less given their lower relative volatility. Still, investors who have turned to these funds in lieu of fixed income amid concern about rising interest rates should keep in mind that they could disappoint in an equity market sell-off, during which it’s not uncommon for bonds to rally. In such a scenario, they’d probably be better off in bond funds.
Over the three years ending July 31, for example, the average high-correlation/low-volatility alternative fund captured 22% of the global equity benchmark’s downside, with the distribution of downside capture ratios shown in Fig.6, but bonds tended to deliver gains: The Bloomberg Barclays US Aggregate Bond Index gained 12% during those down periods over the same span.
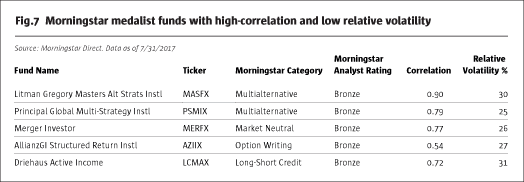
These funds may still appeal to more conservative investors, though even they should be mindful of how they’ll mesh with other holdings as part of a broader portfolio. For investors willing to take the plunge, there are a handful of funds with these characteristics that we do recommend, as shown in Fig.7.
Alternative funds with high-correlation and high relative volatility
In the top right portion of the alternatives style box, one finds liquid alternative funds that are highly correlated with global equities and also relatively volatile. These funds hail predominantly from the long-short equity category. To be included in the category, a fund must consistently have a beta to equities of between 0.3 and 0.8 (for categorization purposes, in the United States the S&P 500 is typically used as the benchmark) and gross short exposure of at least 20%. Given their high relative volatility and net long exposure to equities, these funds tend to be considered as a substitute for other growth assets, like long-only equities.
Long-short equity strategies boast several potential benefits that can recommend them. For instance, adding a long-short equity strategy to a diversified portfolio can lower overall portfolio volatility without sacrificing a significant portion of the equity market’s upside. In addition, short-selling can give managers an opportunity to add excess returns in ways a long-only fund can’t.
Morningstar analysts recommend only one fund that falls in the high-correlation, high-volatility region of the alternatives style box as of July 31: Bronze-rated Diamond Hill Long-Short DIAMX benchmarks itself to a custom 60% Russell 1000/40% cash index, but its net exposure can vary above or below 60% depending on management’s view. That’s typical of the other funds in the long-short equity category and those that fall in the same region of the alternatives style box.
Investors should treat the due diligence of long-short equity funds as they would any active equity manager. The fund’s returns are going to be driven by management’s ability to identify stocks that are both undervalued and overvalued. Some long-short equity funds do add an element of market timing by varying net exposure levels depending on the manager’s view of the broader equity market. These more tactical equity managers can be more easily identified by how their alternatives style box position changes over time.
Alternative funds with negative-correlation and high relative volatility
The opposite corner of the style box is composed of alternative funds that have exhibited a lower (in this case negative) correlation to global equities and higher (at least two thirds that of the index) volatility over the trailing three-year period. Fig.8 shows the section of the style box in which these funds can be found.
Although the style box’s rightmost border ends at a relative volatility of 1—where a fund’s volatility is equal to that of global equity markets—in practice some managed futures, multialternative, and long-short equity funds can be more volatile than global equities over a three-year period (we plot those funds on the style box’s border).
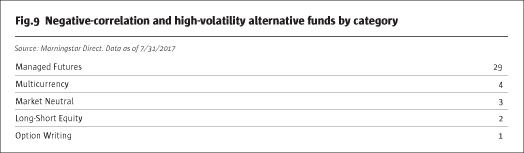
Most of the funds that fall into the lower right corner of the alternatives style box are classified in the managed futures category. Other strategies, like Hussman Strategic Growth HSGFX, which has been net short equities via written options because the manager thinks the stock market’s valuation is unsustainable, can also end up in this corner of the style box. Fig.9 shows the category breakdown.
While having a low or negative correlation to stocks may seem like a desirable characteristic in an alternative fund, since it shows the fund is being driven by different risk factors than equities, it’s important that investors understand why a fund has acted like it has. Managed futures funds look to profit from trends across multiple asset classes. To follow trends, managed futures funds use futures contracts. Futures typically require a small amount of capital to be held as collateral so the funds can have higher notional leverage than strategies that rely on physical securities. Essentially, they bet that winners will keep winning and losers will keep losing. The potential to benefit from assets falling in value, like oil in late 2014 or stocks during the financial crisis, contributes to the strategy’s low and sometimes negative correlation to global stocks.
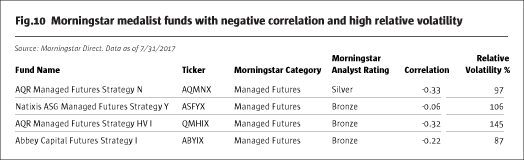
Even though managed-futures funds may have a negative correlation to global equities, trend-following has shown it can still generate positive long-term returns, which investors should expect from an alternatives strategy regardless of its correlation to equities. To be sure, that doesn’t make them a replacement for high-quality bonds, which have similar diversification characteristics and much lower volatility. For investors comfortable taking on equity-like risk in their alternative fund, managed futures could be an attractive option. Other funds with a negative correlation to equities may be positioned to only gain when stock markets fall, which would be less useful over the long term given that equities generally rise over long time periods. There are four funds that fall in this style box that are Morningstar Medalists. Fig.10 lists the funds.
Alternative funds with negative correlation and low relative volatility
In the bottom left corner of the alternatives style box one finds funds with a negative correlation to equities and low relative volatility. The further a fund is plotted toward the bottom of the style box, the more negatively correlated it is. It’s important to remember that a negative correlation of less than 0.5 doesn’t imply the strategy will always act inthe exact inverse of stocks. It does signal that the strategy is not dependent on the direction of stocks to generate returns though, which can make it a useful building block for a portfolio. This section of the style box is the most sparsely populated. Fig.11 shows the category breakdown.

One of the funds is a Morningstar Medalist. AC Alternatives Market Neutral ACVVX had a slightly negative correlation to stocks and bonds over the three-year period and its pair-trading strategy has resulted in a low volatility profile. It earns a Bronze rating.
Similar to other lower volatility alternative funds, investors may see these strategies as an option to replace some fixed-income exposure. Unlike the funds in the top left corner of the alternatives style box, these strategies’ negative correlations to equities shows they had more of a defensive posture when equities sold off. Fig.12 shows the five funds’ three-year downside capture ratio compared to the global equity index compared to the bond index as in Fig.6.
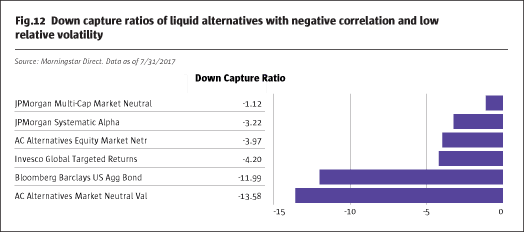
Each of the funds had a negative downside capture over the trailing three years, which means they generated gains while stocks were down, on average, over that period. That doesn’t mean the funds were riskless over that period, of course. It simply means stock market risk was not the main risk driving returns. As stocks are likely the riskiest part of investor portfolios, identifying alternatives that court risks other than stock market beta is ideal.
Conclusion
The examples in this paper cover a short period of time and the results shouldn’t be expected to hold over every market environment. Still, we believe the factors that investors should consider as part of their due-diligence process when evaluating an alternative strategy are unlikely to change regardless of whether the process starts today, tomorrow, or several years from now. Paying attention to how a strategy has been correlated to equity markets over time and in specific market periods, like the volatile third quarter of 2015, and what kind of volatility it has exhibited relative to equities, could help investors better set expectations for alternatives. As liquid alternative funds continue to develop track records, we’ll be able to examine how these factors change over different market environments. For now, investors should still consider these factors as part of the evaluation process.
Morningstar Manager Research provides independent, fundamental analysis on managed investment strategies. Analyst views are expressed in the form of Analyst Ratings, which are derived through research of five key pillars—Process, Performance, Parent, People, and Price. A global research team issues detailed analyst reports on strategies that span vehicle, asset class, and geography.
Morningstar Manager Research Services combines the firm’s fund research reports, ratings, software, tools, and proprietary data with access to Morningstar’s manager research analysts. It complements internal due-diligence functions for institutions such as banks, wealth managers, insurers, sovereign wealth funds, pensions, endowments, and foundations.
The Morningstar Style Box for Alternatives is intended to assist users in their evaluation process and should not be used as the sole factor in making an investment decision. Morningstar shall not be responsible for any trading decisions, damages or other losses resulting from use of the Morningstar Style Box for Alternatives.
- Explore Categories
- Commentary
- Event
- Manager Writes
- Opinion
- Profile
- Research
- Sponsored Statement
- Technical
Commentary
Issue 127
Inside the Morningstar Style Box for Alternatives
Where do liquid alternative funds fall in the alternatives style box?
MORNINGSTAR MANAGER RESEARCH / JASON KEPHART, SENIOR ANALYST
Originally published in the October 2017 issue