UCITS, as defined by the EU, refers to the term ‘Undertakings for Collective Investment in Transferable Securities’. They arose out of calls for an increase in the regulatory oversight of alternative investment managers, setting strict standards in the areas of investor protection, regulation and disclosure. The regulatory bodies of the EU are continually updating and improving upon the product to maintain its relevance to investors, with the most recent UCITS V set of regulations implemented by 17 September 2014.
UCITS funds have become hugely successful over the years with the ‘UCITS-compliant’ branding becoming a huge draw for investors and something for alternative investment managers to aspire to, despite the relatively higher compliance costs. Their attractiveness to institutional investors comes from the increased transparency and disclosure of investments, limited leverage and attractive liquidity terms. Managers have also been looking towards the UCITS platform as a passport to access more European clients and market their funds to clients who are not qualified to invest in sophisticated products.
Implemented in mid-2011, UCITS IV, among many other enhancements, helped to provide the investor with more transparency, facilitate cross-border fund distributions, reduce costs, achieve regulatory alignment, decrease the administrative burden, and achieve economies of scale for the management companies. More recently, UCITS V aims to reinforce some of the weaker points regarding investor protection and align the UCITS and AIFMD directives together. The key provisions include remuneration policies that are consistent with effective risk management, addressing discrepancies on the duties and liabilities of depositaries and harmonizing administrative sanctions. Member states have 18 months to transpose UCITS V into national law.
Industry growth
UCITS hedge funds have maintained a strong pattern of growth in 2014, with the industry delivering modest returns and also attracting plenty of new capital from investors. Currently the size of the industry stands at a record high of $275.2 billion, overseen by a population of 1,016 funds.
Over the last seven years the sector has witnessed different trends – a couple of downturns, a period of stagnation and two strong rebounds. In the year 2007, total assets in the industry stood at $105.5 billion, managed by 300 funds. The onset of the global financial crisis saw the assets under management(AUM) of the industry cut almost in half to $51.7 billion, before recovering sharply to $205.7 billion by 2010. The population of funds also grew by almost 500 during that period (see Fig.1).
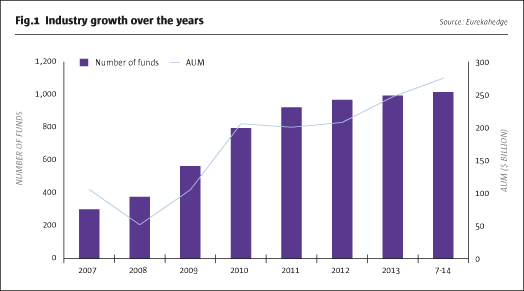
The Eurozone crisis in 2011 brought a temporary halt to this growth trend, with assets retreating slightly to $200.4 billion, remaining largely unchanged during 2012 as well. Since then, the strong rally in global equities in the past couple of years and signs of economic recovery in the US have reignited investor interest in the markets, resulting in a corresponding flow of capital to UCITS hedge funds which witnessed AUM soaring to $275.2 billion by July 2014.
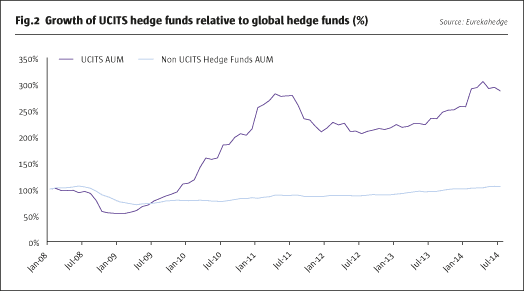
Fig.2 shows the growth in the AUM of UCITS hedge funds relative to the broader global non-UCITS hedge fund industry since January 2008. Both investment vehicles saw a sharp fall in their AUM in the aftermath of the global financial crisis, bottoming out in August to September 2008. However, that is where the similarities end. UCITS funds saw a steep rise in popularity post the financial crisis, growing to over 2.5 times their original AUM by July 2011. European institutional investors’ need for regulated products as opposed to simply going for performance played a role in increasing the inflow into UCITS products. After a retreat and stagnation in 2012, the AUM of the industry resumed its upward march on the back of strong performance-based gains and net asset inflows in 2013. As of the date of writing, the size of the UCITS fund industry has expanded 186.6%, while non-UCITS hedge funds have only gained 5.0%.
It is pertinent to note here that UCITS hedge funds started out with a smaller base AUM, which renders their month-on-month growth figures more pronounced than those for the broader hedge fund industry. Nonetheless, the strong gravitation of investors towards UCITS-compliant vehicles is undeniable.
INDUSTRY COMPOSITION and GROWTH TRENDS
Launches and closures
Fig.3 gives a clear profile of the growth and attrition rate of the industry over the last five years on a quarterly basis. The UCITS sector witnessed a strong period of launch activity in the period immediately following the collapse of Lehman Brothers, and the rise in popularity of regulated investment vehicles, which were seen as a solution to the excessive risk-taking by hedge funds which was blamed for the major losses during the crisis. This encouraged a number of existing fund houses to launch UCITS-compliant funds to tap into the European retail and institutional investor market.
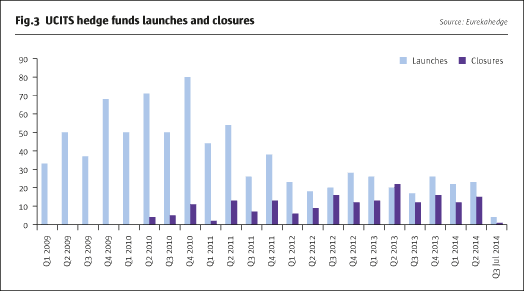
The attrition rate picked up from 2011 to 2012 due to the trends over the last three to four years. Starting in 2011, the onset of the Eurozone crisis dampened investor sentiment and hurt returns, leading to a decline in total assets. Also, most of the investor allocations in the industry have increasingly gone to the larger and more well-established hedge funds. Due to the lack of asset flows as well as the inability to generate performance fees in 2011 and 2012, a number of the smaller hedge funds closed shop in 2012 as it became unsustainable to run their operations on admin fees from a small asset base. The rate of closures peaked in 2013 and has remained generally high since. Rather than a decline in the popularity of UCITS funds, the truth is more likely to be reality catching up to UCITS funds after the surge in population during 2009 to 2010. With a sufficiently long track record, poor performers are starting to be weeded out. The supply of new entrants to the industry, while significantly lower than the previous years, has managed to keep ahead of closures, resulting in a growing UCITS population.
Head office locations
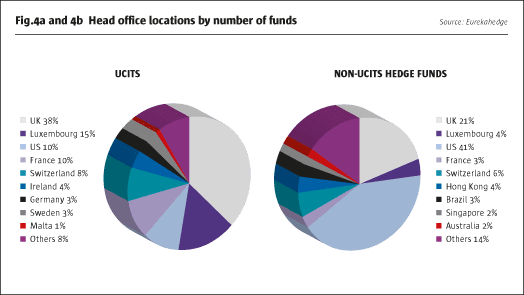
The breakdown of the industry according to head office location shows that most UCITS funds chose to establish their base in Europe. Funds based in the United States, the most popular choice for non-UCITS hedge funds, constitutes only 10% of the population of UCITS funds (see Fig.4b). As UCITS is a European regulation, it perhaps comes as no surprise that the majority of UCITS-compliant hedge funds fall within EU jurisdiction (see Fig.4a). The United Kingdom, as the largest financial centre in Europe, is home to the largest number of UCITS hedge funds at 38%, whereas Luxembourg takes second place with 15%. Despite being conceived primarily for EU investors, the UCITS branding is becoming increasingly recognized worldwide, with a small but growing number of hedge funds in North America and Asia Pacific jumping on the bandwagon.
Domicile
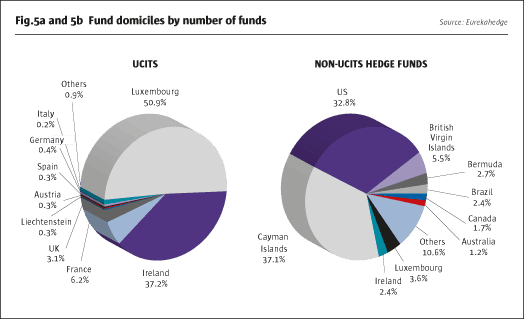
Fig.5a and Fig.5b show the breakdown by country for the UCITS and non-UCITS hedge fund industry. Luxembourg is the premier choice for UCITS funds, followed by Ireland, capturing 88.1% of the market share between them. This is in stark contrast to the only 6% market share for the two countries for non-UCITS hedge funds. Luxembourg played a key role in supporting and promoting UCITS during its early stages, gaining a significant head-start over other domiciles in attracting UCITS funds. While being a later entrant to the sector, Ireland has also been making good headway in growing its share of the business, and as such we expect both locations to gain further traction as the AIFMD is implemented in the region.
Geographic mandates
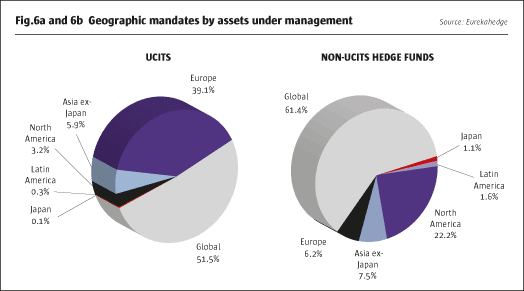
Fig.6a and Fig.6b display the breakdown of assets allocated to UCITS and non-UCITS hedge funds according to their various regional mandates. Similar to non-UCITS hedge funds, the majority of UCITS hedge fund assets are invested with a global mandate (51.5%). Adopting a global mandate has helped fund managers diversify their risks and also access a wider selection of securities to capitalize on the latest macro trends. Unlike the rest of the hedge fund universe, UCITS funds have a disproportionately large amount of assets devoted to Europe at 39.1% – roughly 33% more than the allocation by non-UCITS hedge funds. This is a natural consequence of the investors and managers of UCITS funds being largely based in Europe, and thus favouring investments in the home countries with which they are familiar.
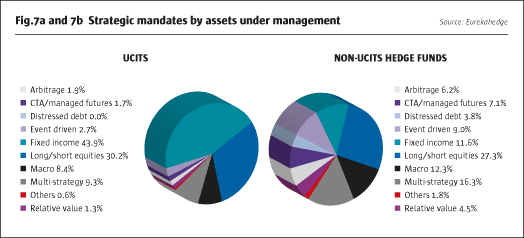
Distribution of AUM across the various strategies has also varied over the years and the current breakdown is quite different from what it was six years ago – the most prominent being the decline of assets allocated to long/short equity funds. Most of this drop happened during the financial crisis when long/short equity managers witnessed heavier losses than most other strategies. As the hedge fund industry continues to grow and mature, investors also increasingly demand a less equity-centric style which offers more diversification benefits for their portfolios. However, the UCITS framework imposes liquidity constraints on managers, which somewhat limits their universe of available investments. Furthermore, complex strategiessuch as credit or capital structure opportunity strategies are difficult to replicate in a UCITS wrapper, especially with the 10% limit on exposure to any single issue. Long/short equities, fixed income and macro funds, which invest in relatively liquid asset classes, together make up 82.5% of all UCITS fund assets, compared to 51.2% for non-UCITS hedge funds. UCITS funds utilizing a multi-strategy are another popular choice and constitute 9.3% of the total industry AUM.
Fees
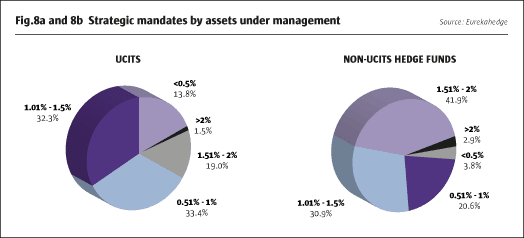
One of the criticisms of the UCITS framework is that the additional layer of regulatory requirements would place a greater financial burden on fund investors in the form of compliance costs, which translates to higher management fees. However, Fig.8a and Fig.8b show that this is not necessarily the case. Almost 50% of UCITS managers charge a fixed fee of 1% or less, compared to only 24.4% of non-UCITS hedge fund managers. As at July 2014, the average management fee charged by UCITS hedge funds stood at 1.2%, compared to 1.6% for non-UCITS hedge funds. Moreover, a full 21.1% of UCITS funds do not charge any sort of performance fee whatsoever.
PERFORMANCE REVIEW
This section of the report takes a step back to look at the bigger picture by placing the global UCITS hedge fund industry performance in comparison to other alternative investment vehicles – namely non-UCITS hedge funds, funds of hedge funds, and the benchmark MSCI (MSCI AC World IMI Index (Local)). We also break down global UCITS hedge fund performance according to geographic and strategic mandates, taking into account their annualized returns and volatilities over the last five years in the following charts and tables.
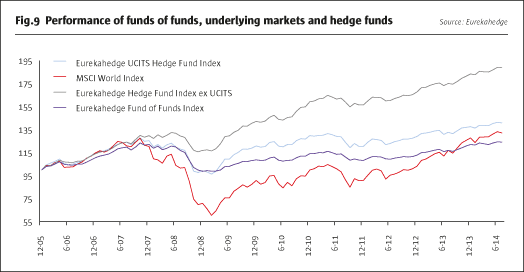
Since December 2005, the Eurekahedge UCITS Hedge Fund Index has gained 40.85%, outperforming the benchmark MSCI World Index (MSCI AC World IMI Index (Local)) and the Eurekahedge Fund of Funds Index, which were up 32.06% and 24.12% respectively. However, this pales in comparison to the Eurekahedge Hedge Fund Index ex UCITS which returned 88.90% over the same period. This discrepancy in performance could be explained by the additional restrictions placed upon UCITS funds, which regulate the degree of liquidity, level of leverage, instruments traded and diversification requirements, resulting in a depression of UCITS fund returns when compared to their less regulated hedge fund counterparts. Despite their limitations, UCITS hedge funds have made good headway and avoided any major drawdowns, occupying a valuable niche in the market for retail and other investors who may not be willing or able to access more sophisticated investments like hedge funds.
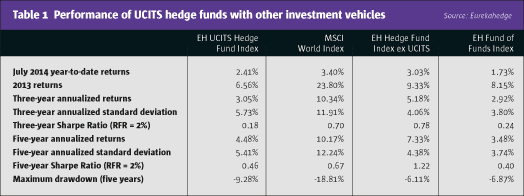
Table 1 summarizes key statistics across the four investment vehicles and shows that non-UCITS hedge funds offer the best risk/reward profile over both the three and five-year time periods – Sharpe ratios of 0.78 and 1.22 respectively. Hedge funds also exhibit less volatility and tail risk (lowest maximum drawdown), which could be attributed to their greater flexibility in hedging their exposure. UCITS funds, which have the potential to make the fund of funds structure redundant, trump the latter in terms of their five-year Sharpe ratio, but fall behind when considering a three-year horizon. In terms of annualized returns, the MSCI World Index leads the table for the three and five-year period due to the multi-year rally in global equity markets, but also possesses the highest annualized standard deviations out of all investment vehicles.
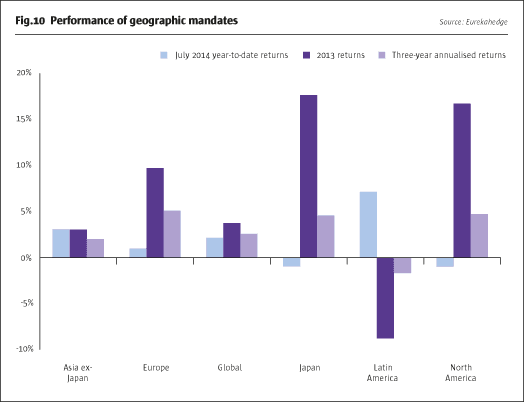
Fig.10 displays the performance of global UCITS funds across the various regional mandates. Latin American UCITS funds posted the strongest July 2014 year-to-date returns, up 7.13% due to a strong showing in Brazilian equities. The Brazil IBOVESPA Index gained 8.39% in the first seven months of the year. Globally focused funds, which manage the bulk of UCITS fund assets, returned 2.14% during the same period, though underperforming the Eurekahedge Hedge Fund Index ex UCITS (see Table 1) which was up 3.03%. These phenomena of UCITS hedge funds underperforming their regular hedge fund counterparts are quite a recurrent theme, hinting that investors are willing to trade the additional liquidity afforded by UCITS hedge funds at the cost of a drag on performance. UCITS fund managers have to be aware that this might result in less tolerance for lacklustre performance as investors can quickly withdraw their funds on a whim. In terms of 2013 returns, UCITS fund managers investing with a Japan mandate generated the highest gains – up 17.62%, attributed to short positions on the Japanese yen versus dollar and long positions on the Nikkei. North American and Europe mandates also produced notable gains of 16.70% and 9.69% respectively.
With regard to their risk/reward characteristics, European UCITS funds boast the best three-year Sharpe ratio of 0.78, beating the Eurekahedge European Hedge Fund Index’s 0.34 Sharpe ratio. Latin American funds, despite their strong showing in 2014, pose significant risks to investors with the highest three and five-year annualized standard deviations and maximum drawdown of almost 16%.
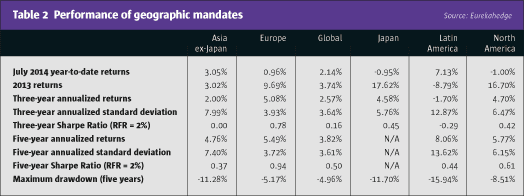
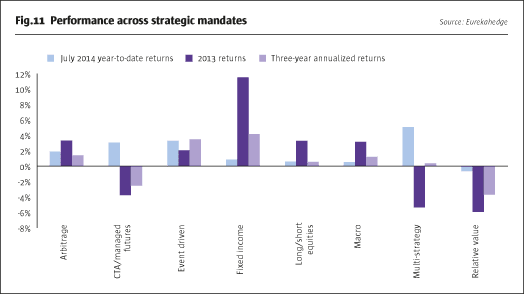
Fig.11 displays global UCITS fund performance in terms of July 2014 year-to-date, 2013, as well as three-year annualized returns, by segregating them into various strategies. As shown, UCITS hedge funds have done pretty well so far this year, with almost all strategic mandates in positive territory. However, funds utilizing relative value strategies, while only a small fraction of UCITS assets, have not fared as well recently, being the only strategy down this year (losing 0.68%) as well as the poorest performing strategy in 2013 (down 5.97%). Long/short equities managers were the top performers in 2013 with gains of 11.42%, lifted by a round of upward moves in underlying markets explained by strong economic data out of the United States, Japan’s monetary easing policy and a renewed investor confidence.
Among all the strategies, fixed income managers, which happens to be the most popular strategy by AUM, possess the best risk/return profile over the three and five-year time horizons, with a Sharpe ratio of 0.45 and 0.71 respectively. Table 3 also shows that the CTA/managed futures strategies are the most volatile by far over both time periods, with a five-year maximum drawdown of almost 14%.

CLICK IMAGE TO ENLARGE
- Explore Categories
- Commentary
- Event
- Manager Writes
- Opinion
- Profile
- Research
- Sponsored Statement
- Technical