Managed Futures Performance and Volatility
Understanding the post-crisis CTA market
NICLAS CARLSSON, PARTNER and PORTFOLIO MANAGER and MARTIN ESTLANDER, CEO, ESTLANDER & PARTNERS
Originally published in the January/February 2014 issue
Over the past several months Estlander & Partners Ltd has been evaluating the post-crisis results of managed futures, particularly trend following, relative to decades-long results in global macro trading. Such analyses are core to our approach to quantitative research where we are always re-evaluating our theses for validation and to garner new insights we may not have considered previously.
We also wanted to better consider what can be expected for the strategy in the future, given various potential environments. We feel this is particularly relevant given the persistent non-market forces (e.g., central bank activity) influencing capital and commodity markets over the past several years. Here we share with you our approach and some preliminary observations that leverage both our CTA and option market-making heritage.
Methodology
Using a theoretical long straddle portfolio (the Estlander & Partners Straddle Index, ESI) as a proxy for trend following in order to extend our analysis over decades, we evaluate this trend following proxy since 1950, measuring results of the strategy over full and multiple economic cycles. This is the perspective we have embraced in our proprietary investing and one that we believe is relevant for investors when making allocation decisions. Our proxy portfolio is constructed as a portfolio of at-the-money, 12-month straddles for up to 62 markets representing a traditional trend-following portfolio. Straddles are added to the portfolio monthly and priced using 100-day realised volatility.
Note that in contrast to trend following’s positive absolute return profile, an actual straddle portfolio priced in real market terms would be unprofitable because implied volatility trades at a premium to realised volatility, transaction costs, etc. Nonetheless, the theoretical long straddle portfolio, analysed using realised volatilities, properly reflects the experience of a long volatility investment for our purposes.
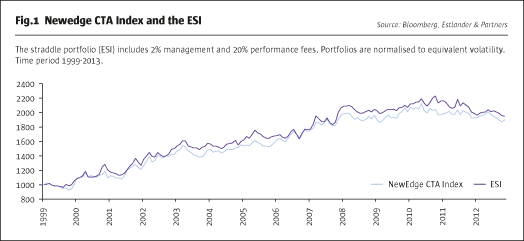
To demonstrate that our straddle portfolio represents a fair proxy for the CTA sector, we compare accumulated values of our proxy portfolio to the Newedge CTA index (See Fig.1). Note these two “portfolios” exhibit approximately 0.80 correlation.
Observations
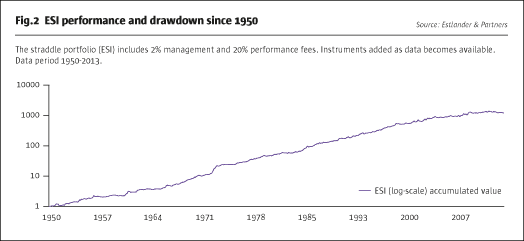
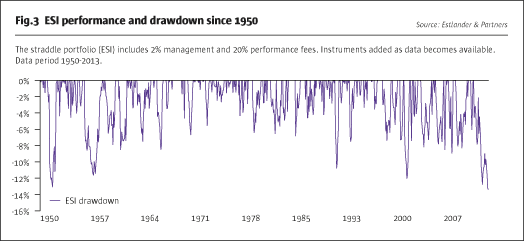
Here we look at the performance of the straddle portfolio since 1950 to garner a sense of return, volatility, and cyclicality of a long volatility investment in the global macro markets. Although it is clear that the ESI has generated considerable accumulated returns over the years, as has trend following, performance has flattened out more recently (see Fig.2) and the portfolio is in a historically large drawdown (see Fig.3), again, similar to trend following.
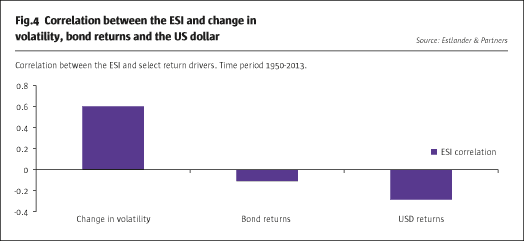
Next we focus on the impact from changing volatility, as defined here by the ratio of realised quarterly volatility divided by realised volatility in the quarter one year prior.
Fig.4 shows that there is a correlation of approximately 0.6 between changes in volatility and performance of the ESI. In addition, since 1950, both bond markets and the US dollar have a measurably smaller relationship to the long volatility performance profile of ESI.
We also look at correlations since 2000 (see Fig.5) and see that the change in volatility retains its strong relationship to the ESI. Noteworthy is the change in correlation between bond returns and the ESI when comparing the full history to this more recent period. The correlation more recently has moved positive, though still below that of the change in volatility.
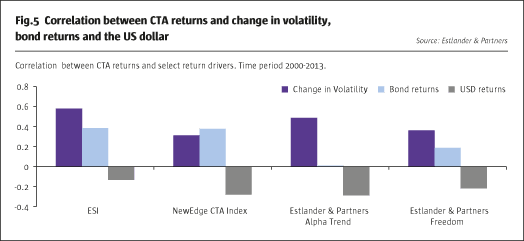
Also in Fig.5 we see that for the NewEdge CTA Index, bonds have been a slightly more dominant factor than both the changes in volatility and the US dollar. In addition to the pronounced decline in interest rates over this time period, this may also demonstrate the considerable increase in fixed income exposure observed from the largest managers in the space.
Fig.5 also includes Estlander & Partners’ Alpha Trend and Freedom programmes where in both the change in volatility remains the more dominant factor.
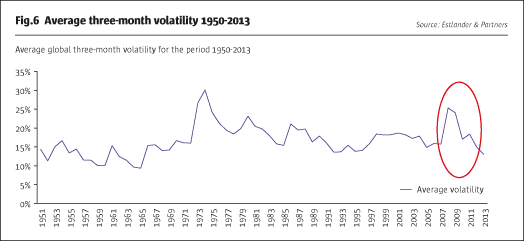
Perhaps most dramatically, when we look at the recent negative performance of our straddle portfolio (see Fig.2 and Fig.3) it seems apparent that the losses coincide with the dramatic decrease in volatility since the historically high volatility in 2008 (see Fig.6).
Summary
Our research continues, though we thought the work we have done to date provides some constructive insights, including:
- An intuitive explanation of why so much of the capital invested in CTAs following 2008 has underperformed expectations and long-term averages in trend following performance. These flows were “purchasing” volatility at some of the most expensive levels in decades. Volatility has since collapsed, penalising the long volatility exposure and resulting in losses for trend-following investments.
- At historically low volatility currently, investors again should re-evaluate the opportunity of trend following. Though rising volatility appears optimal for trend strategies, stable volatility has also produced profitable opportunities historically.
- To the extent that central bank policy can explain the collapse of volatility, their motivation post-crisis has been to support economies and limit the downside of asset prices. Such policy does not preclude volatility in the form of asset inflation.
- The recent equity market rally and exhaustion of many successful relative value trades deepens the need for true diversification within most portfolios today.
Estlander & Partners, through its systematic macro strategies, including trend following, has historically provided traditional and alternative investment portfolios with some of the most important return attribution and diversification since the formative years of hedge fund investing. We continue to aim to provide ready access to the broad commodity sector, liquid exposure to diversified financial markets, and disciplined, objective risk taking.
Estlander & Partners Ltd (E&P) is a CFTC-registered CTA and SEC-registered investment adviser based in Helsinki, Finland. Since 1991, E&P has managed globally diversified and systematic macro investment strategies on behalf of clients. As of January 2014, E&P have approximately $650 million in AUM.
- Explore Categories
- Commentary
- Event
- Manager Writes
- Opinion
- Profile
- Research
- Sponsored Statement
- Technical