
Since its first client trade was executed in 2010, Quantitative Brokers (QB) has been a pioneer in best execution for FICC (Fixed Income, Currencies and Commodities) markets. “When Robert Almgren and I worked at Bank of America in 2006-2007, we were providing best execution solutions for equities, but clients told us they had nothing for FICC. This was the perfect opportunity to build QB. Our initial focus was on futures, and we have now expanded to cover the full FICC spectrum including options on futures,” says co-founder and CEO, Christian Hauff.
While some asset managers, to this day, may try to transplant solutions designed for equity markets onto FICC markets, they are profoundly different in terms of market structure and microstructure. Hauff enumerates four key differences on trading costs, trading hours, matching processes, and term structures. “The bid/ask spread is much higher, measured in dollars or tens of dollars per lot, versus pennies or fractions of a penny for listed equities. FICC markets are effectively open almost 24-hours, so are highly sensitive to events such as intraday economic data releases from the G20 and emerging markets, which need to be forecasted and modelled for their impacts on volume, volatility, and liquidity. In contrast, equity news is mainly released pre-open or post-close. Futures also have unique matching engines, based on different formulas, which could be FIFO (First in, First Out), price/time engines, pro-rata logic or hybrid combinations thereof. This influences tactics for gauging probabilities of obtaining passive fills, which also need to take account of the high bid/offer spreads. Term structures in futures markets and correlations along the curve are also important and we calculate them in real time using cointegration to help optimize execution”.
It is worth discussing QB’s analytical and conceptual framework before outlining their offerings.
We reverse engineer the calculations and relationships so that we can always locate the true liquidity in the marketplace order book.
Robert Almgren, Quantitative Brokers
Defining and measuring liquidity and volume
QB’s proprietary measures of liquidity and volume can be different from headline figures, due to other differences between equities and FICC. Dark pools per se do not exist in futures markets, but some proportion of order book volume can be hidden, due to “iceberg orders” whereby the full size only becomes apparent after orders are filled, or due to nuances around whether matching engines require trades behind calendar and intermarket spreads to be displayed. “Exchanges can be quite complex under the hood. The quote may show 1,000 lots but an additional 5,000 could be sitting behind that. We make deductions about hidden liquidity based on visible trades. Listed spreads and related outright contracts can be used to draw inferences about invisible liquidity. We reverse engineer the calculations and relationships so that we can always locate the true liquidity in the marketplace order book to help make opportunistic decisions about liquidity that is not disseminated,” says co-founder and Chief Scientist, Robert Almgren, who also teaches High Frequency Markets at Princeton University
“Implied liquidity is specific to futures markets, where there are multiple interrelated maturities and there may be more action in calendar spreads, butterfly spreads, spreads of spreads and other more complicated contracts, than in the front month contract. There could be hundreds of potential combinations of calendar and other spreads which might have six or more legs, and the best prices could be found by combining these. Implied liquidity is inferred from combining these spreads to arrive at implied quotes for price or maturity levels even where no explicit quotes exist,” Almgren explains. Tracking trades behind calendar spreads then feeds into QB’s proprietary measures such as augmented volume. A wider aperture for viewing liquidity and volumes then helps QB algorithms to reduce transaction costs, which QB also has its own perspective on. If liquidity needs to be more precisely quantified, QB argues that some transaction cost analysis (TCA) outputs are in fact spuriously precise.
Transaction cost analysis (TCA) and slippage
“Slippage” is a loose term meaning achieved price versus benchmark, which can be conceptually split into several elements. “Market impact” is endogenous – an investor’s effect on the marketplace while “market drift” is exogenous – the natural pathway that a market would have taken over time anyway. A further refinement is that market impact could contain an element of alpha where the investor accurately anticipated the move. “Impact cannot actually be disentangled from alpha due to the endogeneity issue – it is not possible to work out if the order caused the move or the reverse. The drift could in fact be alpha,” says Almgren. Therefore, the models cannot practically break down slippage into its constituents and are best seen as tools to help asset managers plan trading. “Clients use the algorithms to schedule their daily execution, over intraday or over multiple days. QB’s analytics and research are helpful tools for efficient execution of their orders,” says Head of Research, Shankar Narayanan.
The accuracy of QB’s slippage forecasts varies with factors such as strategy, speed, volume and volatility, and QB has a different angle on these variables. For instance, “The consensus for pre-trade planning is that trading larger or faster costs more, because there is less liquidity over a shorter time window. Our view is that larger trades might be higher conviction and more likely to be accurate,” says Almgren.
QB also prefers to measure slippage in ticks rather than basis points. “Basis points are based on notional value, which varies, but the minimum price increment, or tick, is a fixed dollar unit. Measuring slippage in basis points can distort the historical results of algo performance in instruments which are subject to significant price moves. We track effective spread, volatility and liquidity characteristics to distinguish performance in such market regimes,” argues Hauff.
TCA is continuously evolving. Back in 1999, Almgren and mathematician Neil Chriss (who later founded hedge fund manager Hutchin Hill) co-authored a paper that changed the way pre-trade TCA was done. “We added time horizons as a variable, on top of opportunity cost and volatility risk. QB’s approach has now evolved beyond this as execution depends not only on the schedule but also on being opportunistic in the marketplace,” says Almgren. QB’s algorithms and TCA offerings are dynamic and adaptive. “As the market evolves, we are constantly looking at our performance and making enhancements,” says Head of Marketing, Joyce Medeiros.
Transaction costs before and after the Covid-19 crisis
QB closely monitors multiple definitions of liquidity on a daily and intraday basis, with analytics including regressing price changes against order imbalances between buy and sell orders, over various time intervals. “March 2020 saw not only a spike in slippage but also higher dispersion, so the chances of executing close to arrival prices were much lower. Whether transaction costs have returned to normal since the Covid-19 panic in March 2020, varies by market. Crude oil is relatively back to normal,” says Narayanan. In April 2020, QB research found that liquidity and quote size in crude oil futures had roughly halved since the start of the year. In August 2020, QB research observed that liquidity and quote sizes in crude oil had improved since June 2020 but remained worse than in July 2019. In contrast, “wheat is not close to last year’s levels, and though the S&P 500 futures is better than it was in March, it is not back to normal yet,” he adds. Rates are a different story again: in October 2020, QB analysis suggested that interest rate futures liquidity had improved year on year. The liquidity picture also varies along the curve and investors should not presume that the front month future is necessarily the most liquid. In October 2020, QB observed that “far contracts of Crude and Brent oil have better liquidity than the near ones”.
Forecasting slippage regimes
Liquidity and slippage fluctuate with market conditions. QB forecasts volumes and bid/offer spreads across the term structure, based on intraday volume and liquidity including average quote sizes for certain intervals and times of the day. “These real time forecasts can be transparently tracked against realized metrics,” says Narayanan. The forecasts can be used on a standalone basis, and they also inform dynamic adjustments to execution algorithms. “We have also developed proprietary methods to use intraday indicators to adjust algorithm behaviour and identify market shifts from low to high slippage, which may be temporary intraday events or can be longer lived. A systematic approach can detect these,” says Almgren. “We are adaptive in detecting changes in term structure, volumes, volatility and liquidity and identifying shifts from low to high slippage regimes, which can be intraday, multi-week or multi-month. These influence how passive or aggressive you could be. The algos are increasingly being adapted to regime shifts, with machine learning being used to detect regimes and map products,” says Narayanan.
Use of machine learning
“We are increasingly employing machine learning to evolve and further automate certain analytics and workflows. It is all seamless, intuitive and dynamic, using real time data inputs. But we are selective about where it is most appropriate to use machine learning. AI and machine learning work well where there is much input data and variables. One example would be a standalone smart order routing model we built with a summer intern. We eventually did a neural network with 85 variables including trade size averages and quotes to generate limit orders. This could not be done with a classic model. However, for a market impact model there are not enough orders to build a machine learning model at the parent order model, so a standard regression model is more appropriate for lower frequency activities. Where a model is an input rather than a standalone, this also makes sense,” points out Almgren.
QB’s suite of algorithms
QB currently has seven algorithmic strategies. “QB doesn’t design algorithms as much as we design strategies for addressing certain objectives and all of the details about how to manage the distinctive characteristics of the market. Each algo is born out of a deep conversation with clients. Whenever we release an algo it is optimized for a specific objective and our benchmark is the performance metric the algo targets to minimise slippage and maximise alpha,” says Global Head of Product and Head of EMEA, Jonty Field. Each algorithm is focused on different execution objectives, such as capturing spreads, executing at the settlement, prioritizing urgent orders, and rolling futures.
“The flagship algo, Bolt, focuses on the most common goal of getting the lowest price for a buy and the highest price for a sell without the use of a schedule. The flagship generates the most revenue with Strobe being the second biggest. In late 2018, QB launched The Roll algo which is predominantly active around roll periods. Clients have also found this strategy useful to execute liquid vs. illiquid contracts. Closer optimizes execution around settlement and is the fastest growing,” says Field. “Legger is a key differentiator. Historically, firms manually traded multi-legged structures but Legger creates a more disciplined execution profile with a better feedback mechanism,” says Field. Legger can cope with more complex trades that have any number of legs within or between exchanges, and it lets users specify their tolerance for legging risk – which allows some legs of the trade to be filled before others.
Striker marks QB’s first move into options on futures, initially for CME Group options on futures.
We are a leader in arrival price and were one of the first to provide a relative value algo solution.
Christian Hauff, co-founder and CEO, Quantitative Brokers
Algorithm development and future algorithm launches
“Performance is a combination of our signals and also QB’s trading engine,” says Alina Rakhmamimov, Technical Lead – Algo Development, who works closely with multiple teams within Technology, Research and Product to build new and enhance existing algorithmic strategies. “The algorithms can be changed in response to market conditions, volatility and client feedback. For instance, we have made Bolt more scalable and we can now customize features according to a client’s needs,” says Rakhmamimov, who featured in The Hedge Fund Journal’s 50 Leading Women in Hedge Funds 2020 report published in association with EY. “The algo parameters are typically updated as products and markets evolve. We do not want to make too many configuration changes,” explains Field.
“The next big project is expanding the options algorithm, Striker, to cover energy and equity, and a brand new algo may also be launched in 2021. This is likely to focus on optimizing baskets and portfolios rather than individual instruments,” says Narayanan.
What differentiates QB algorithms?
“Buy side and trader clients use a variety of other primitive and complex algo offerings,” says Hauff. QB algorithms are very different from those offered by large banks and prime brokers, partly because QB’s aforementioned conceptual framework looks at liquidity, volumes and quote sizes to improve execution quality, while also measuring and providing transparency on transaction costs to clients.
Hauff reiterates that, “Naturally QB algos are not derived from equities. Our algorithms are custom built, and purpose built for the FICC market”. He stresses the customized nature of the algorithms: “We designed them product by product, and exchange by exchange, to factor in the nuances and microstructure. We did not copy and paste, and mass deploy,” says Hauff. “For instance, recently, algos have been tailored to the new exchanges we have onboarded, ASX and SGX. We are very thoughtful in optimizing respectfully to each market. The market structure is entirely different, we generate liquidity and volatility forecasts tailored to each one of the contracts we execute.”
“Moreover, the algos are all built, researched and engineered by QB, with no third-party input, whereas some banks are essentially rebranding algos from third parties,” according to Hauff.
“QB algorithms are also dynamic, as opposed to being parameterization for sophisticated order types such as icebergs, pegging, order cancellation or other mechanisms. Dynamic algorithms are superior because they respond to real time conditions. For instance, we are a leader in arrival price and were one of the first to provide a relative value algo solution,” says Hauff. For example, one adaptive feature is that QB algos can alternate between passive and aggressive approaches as pricing signals change.
The algorithms are customizable. For instance, “Orders are channeled to various price levels based on the client’s urgency factor, and volatility levels, and keeping them within 5% to 10% of the limit order book. The exact levels depend on the depth of visible quote sizes. As each order is worked, the others are redistributed,” says Narayanan.
“The central difference between most algorithms and our flagship, Bolt, is that we do not have an explicit time or participation rate target which allows Bolt to be more opportunistic and adapt to market conditions and opportunities that arise. Bolt’s time horizon is therefore a function of market conditions and opportunities to minimize slippage and retain alpha,” says Field.
Which execution benchmarks?
QB’s seven algorithms collectively use eight execution benchmarks:
- Arrival Price
- TWAP
- VWAP
- Target Price
- Cash Close
- Settlement Price
- Sweep to Fill (STF)
- Arrival Fair Value
Each algorithm normally maps to one or two specific benchmarks, as shown in Fig.1.
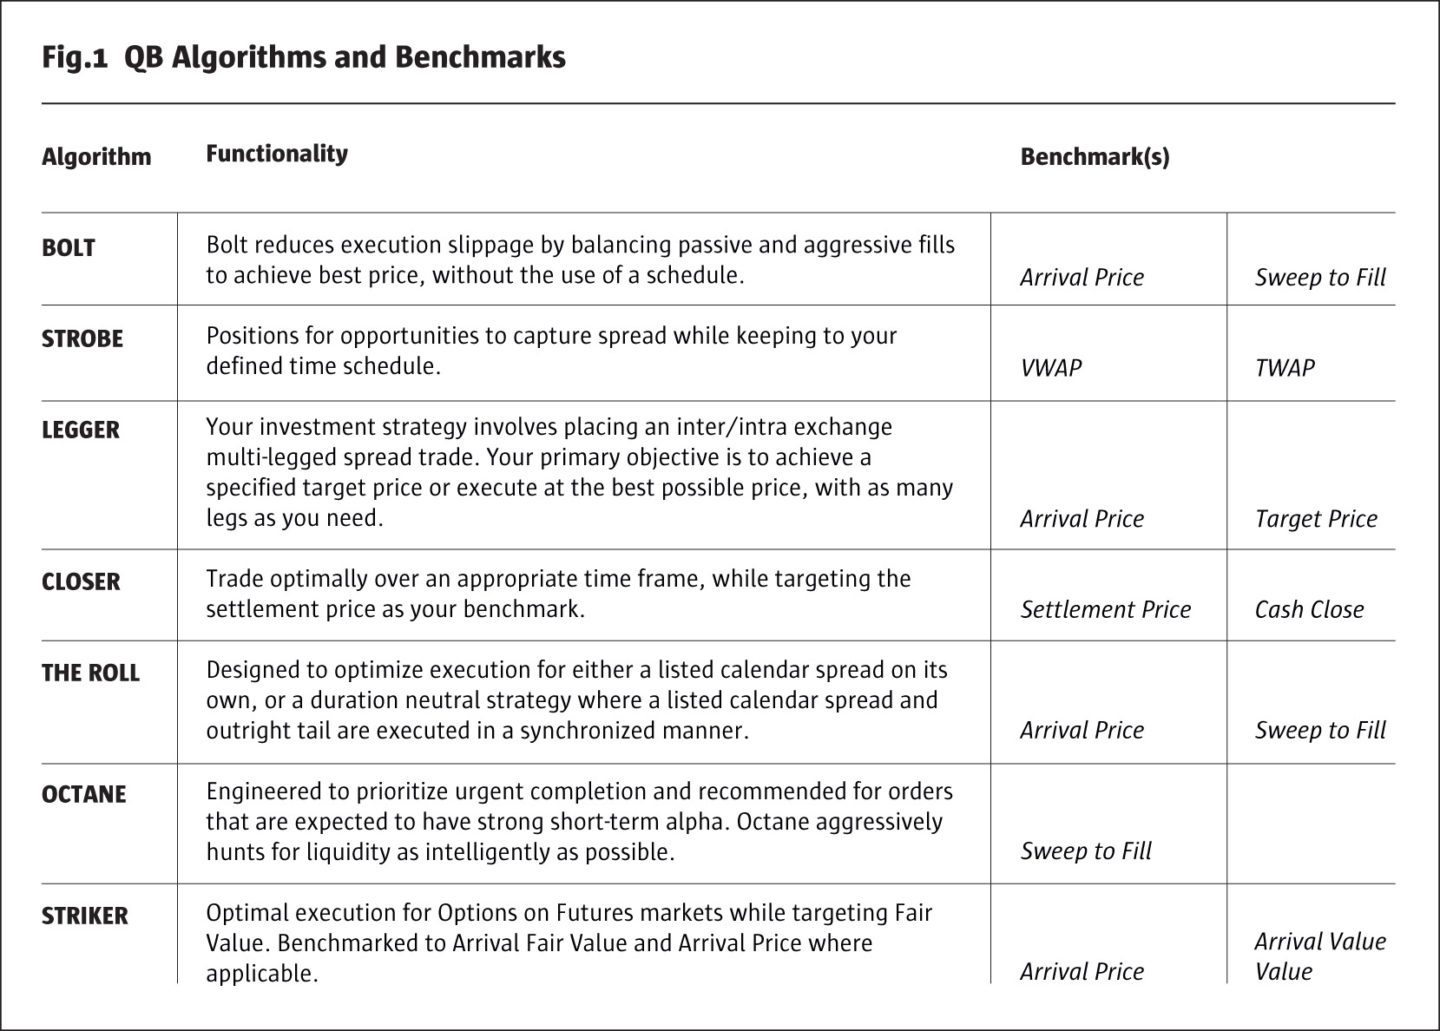
“The benchmarks can mainly be grouped into implementation shortfall measures, such as arrival price or sweep to fill, and schedule-based measures, such as TWAP and VWAP,” says Rakhamimov. “The latest algorithm added, Striker, needed a new benchmark of arrival fair value because some options do not have a listed price,” she points out. “The most popular benchmarks are arrival price and VWAP. Trading at the settlement price is also quite widely used, for instance for crude oil,” says Narayanan. But the use of benchmarks is nuanced.
Benchmark choice can vary over the life cycle of a trade: “VWAP and TWAP can be used as benchmarks during the roll period when arrival prices are not used,” points out Narayanan. And benchmarks do not necessarily dictate trading strategies: “Many clients may trade VWAP and TWAP even if they do not use it as a benchmark all of the time”. It is also possible to devise hybrid benchmarks. “Clients sometimes use a weighted blend of two or more benchmarks, particularly for sizable orders. They might do a split of 30% arrival price and 70% scheduled base algorithm,” says Narayanan. “Clients can choose which benchmarks to use, though we do educate them based on flow and need. Most of the time some customization is possible for smaller order sizes, trading at unusual times of the day such as 3am or adjusting the time of day that defines the settlement price,” he explains. But QB is anxious to avoid an excessive proliferation of benchmark types: “We want to focus on meaningful benchmarks and do not want too much choice or overly similar benchmarks. We would release a new algo when there is a meaningful shift in benchmarks,” says Field.
Algorithm focus: Roll timing forecasts and “The Roll”
One of QB’s algorithms, “The Roll”, is geared to the term structure of futures markets. In order to facilitate their client’s execution, QB provides specific Roll Forecasts for some of the larger roll events, these are very helpful to clients helping them time their execution. “Rolls are an unavoidable event and the buy side has not paid enough attention to these transaction costs. Many investors often wait for a broker to tell them the market has shifted. There can be huge costs as the spread in terms of tick value is significant on all legs. We have built analytical tools that help to identify the pace of intraday shifts and track the real costs of execution and rolling which we call The Roll Tracker,” says Narayanan.
2020 has seen considerable volatility in roll costs. The direction of roll spreads can reverse in a matter of months. “Wheat and agricultural contracts are in contango in September 2020, but in February when demand was uncertain, the spread went into backwardation and stayed there into March and April,” says Narayanan. “A key trend in contango and backwardation this year was the oil price crash and then negative West Texas oil prices in April. We systematically traded through it, having had experience of negative pricing before on term structures and listed spreads. Our models are built to accommodate negative values,” he adds. The analytics need to be tailored to individual markets: “Brent crude oil has different dynamics because, being seaborne, it does not have the same delivery mechanisms or storage,” he points out. “The trade war and tariffs can also be important for some markets,” he adds.
Which roll variables are easiest to forecast?
QB uses historical and intraday volume data, and some economic data, to forecast volumes, open interest, and roll spreads, with varying degrees of accuracy. “It is easier to forecast volume and open interest, than price changes. Our Roll Tracker, which is mainly focused on near term contracts, forecasts open interest and is fairly accurate, including intraday and real-time adjustments. Our Roll Tracker publishes the pace of the roll for over 40 contracts and it is public on our website,” says Narayanan. If volume is easier to forecast than the price direction of calendar spreads, then the magnitude of spread moves is, in turn, most difficult to predict.
QB have built multi-factor models to forecast changes to calendar roll spreads. “The models are tailored to individual markets, based on CME delivery dates and roll periods, which vary by markets, and we have published research on specific markets for clients. We forecast them very accurately 7 times out of ten. Overall, it is impressively accurate, but we have seen some rolls that had unprecedented or unique conditions due to huge spikes or shifts in volatility,” admits Narayanan.
The timing of rolls is an important decision for investors: “Our slippage algorithms show that transaction costs are determined partly by whether you roll early or late. We have gathered statistical, economic, position and market data and have developed proprietary modelling of the relationship around it. Our initial roll forecast gets constantly updated in real time,” says Narayanan.
A distinctive business model
“The buy side client base runs the gamut of hedge funds from those with over $100 billion USD, to smaller CTAs, proprietary traders and pension funds. Clients can experiment with us to see if value is being added. We are expanding particularly in Asia,” says Hauff. Nearly all clients have at least two other brokers now, and most use the integrated package of execution algos and TCA – but they can mix and match QB algos with other TCA packages if they wish.
QB is perceived as an outsourced quant execution firm, and the business might appear to be a cross between a brokerage and a FinTech, software or analytics vendor, but the business model is simply and clearly defined by charging commissions for transactions. “Our revenues are solely tied to clients’ usage and activity. We are incentivized to solve client slippage, and demonstrate value added,” says Hauff.
QB is broker-neutral and works with all major executing brokers, clearing brokers and FCMs. “Our clients clear with the top 25 clearing houses. We work with clearers, on top of, or in synchronization with, their execution infrastructure or workflows. We aim to offer best of breed algo solutions that can apply across all client relationships,” says Hauff. All of QB business goes through executing brokers. “QB was perceived as a competitor at first but brokers now view us as positive in our laser focus on best execution algorithms, analytics, architecture and approaches. The vast majority of the bank community are partial to us and we work in partnership with them to improve execution,” says Field. “Onboarding has been pretty straightforward. These are healthy relationships for mutual clients. Engagement with EMS and OMS providers can become more challenging with complex order types but is generally straightforward as our desk works closely with the providers,” he adds.
Our smart order router is a real innovation for Cash Treasuries, addressing the toxicity of venues in the space and linking into our algorithmic mindset.
Shankar Narayanan, Head of Research, Quantitative Brokers
“We are integrated with many EMS/OMS providers and we are constantly working with their technology teams to maintain and enhance our interface compatibility,” says Medeiros. “Some of our clients use a combination of front ends including our Bloomberg app or proprietary systems, all of them which we can support and integrate using the FIX protocol,” she adds.
Incidentally, QB is not a MiFID firm and nor does it provide MiFID reporting, but “we ensure that the relevant data fields are captured and tagged,” confirms Field, who appreciates the fact that MiFID II considers liquidity and volumes as well as price in defining best execution.
Market coverage
QB is expanding market coverage on existing exchanges, as well as widening exchange coverage, recently adding Australia’s ASX and Singapore’s SGX exchanges. This process is getting faster. “When I started, it took a long time to on-board exchanges. We have cut the time lag and created a process to scale up the company. Exchanges in China and Japan could be the next additions,” says Medeiros.
Cash Treasuries and smart order router
QB has recently added Cash Treasuries, which marks a new departure in several ways. “We only trade electronic markets, with no OTC coverage. These tend to be centralized, but Cash Treasury markets can be fragmented, and we have published research on the variety of liquidity available on different venues. We only trade On-The-Run Cash Treasuries (but might expand to Off-The-Run in 2021). There is a strong relationship between Cash Treasuries and futures. Some nuances of the Cash Treasury market include that volume is not always perfectly correlated with liquidity, and there can be non-linear relationships between them,” says Narayanan. The disparate nature of the market has prompted QB to develop techniques for aggregating liquidity. “Our smart order router is a real innovation for Cash Treasuries, addressing the toxicity of venues in the space and linking into our algorithmic mindset,” says Field.
Strategic investors and partners
FinTech, financial services and enterprise software private equity growth investor, Centana Growth Partners, has since 2017 been a strategic investor in QB and has provided three board members: Centana Growth co-founders, Benjamin Cukier and Steven Swain, and Centana Advisory Board member, Thomas Ascher.
Deutsche Boerse has in September 2020 acquired a majority stake in QB while the co-founders, Hauff and Almgren, retain significant interests. Deutsche Boerse’s revenues of nearly EUR 3 billion are more than 100 times greater than QB’s estimated 2020 revenues of USD 25 million. “The Deutsche Boerse client base is very complementary to our own. We will also access the wider family of DB group companies, which is very exciting for our clients in terms of market coverage and transparency,” says Field. “We have the same mindset, looking at best execution as not only slippage but also the total cost of trading”.
The DB deal seems set to catapult QB into its next leg of growth, and readers should watch this space for innovations such as new algorithms.
- Explore Categories
- Commentary
- Event
- Manager Writes
- Opinion
- Profile
- Research
- Sponsored Statement
- Technical