Besides movies and TV shows, the phrase “last man standing” has been used to describe a competitive situation in which a single individual remains after all others have been eliminated. In the “ags” market, what is that last crop and what should participants do about it?
Searching for opportunities in the agricultural market is an interesting business. Grains offer investors a fresh start every year because the planting, harvest and storage cycle restarts every year. As the crop year passes, supply reacts to the realities of the market and commodity prices become an excellent transmission mechanism for information to investors and farmers alike. While this is not unique to agricultural commodities, the reaction time for energy and metals, for example, requires many years. In the ags market, the feedback mechanism is far more immediate.
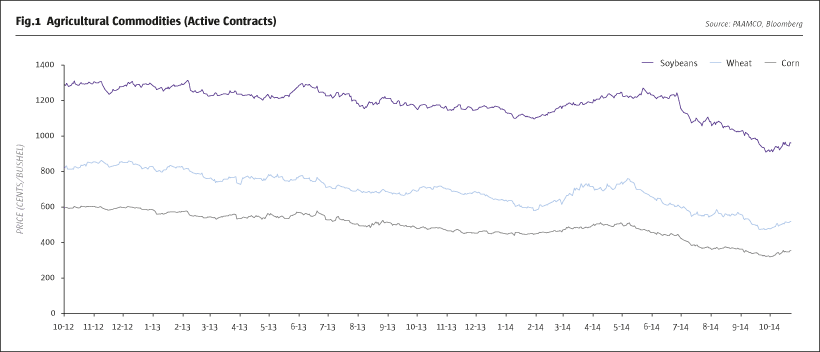
But as efficient as agricultural markets are, they are also constantly changing, which presents many opportunities for fundamental investors. Last year, farmers worldwide produced a record harvest of 13.9 billion bushels of corn, reacting to higher prices due to the previous year’s drought. The additional supply wasn’t absorbed by higher demand; instead, the flood of grains drove corn prices down 40% in 2013 to levels not seen in seven years. Wheat prices experienced a similar trend last year, dropping 28% as yields reached new records.
CLICK IMAGE TO ENLARGE
Early this year, the Russia-Ukraine conflict invited speculators to buy wheat, pushing prices higher than fundamentals would support. While corn is a US-centric crop (accounting for 39% of world production), wheat is harvested worldwide, with Russia and Ukraine exporting meaningful quantities from the Black Sea area. Despite the conflict, shipments have never halted and corn served as an anchor for prices. In May of this year, the relative spread between wheat and corn for December 2014 delivery reached 251 cents. Now it’s back down to 150. Given ample carryover inventories from last year, a short position on that spread was a compelling contrarian opportunistic trade.
Soy is thus the last crop standing. It is now soybeans that look expensive relative to corn. Farmers typically start to switch their planting from corn to soy when the price ratio of the two grains is around 2:1, which has been the case since spring of this year. While wheat and corn are great substitutes for feeding, soy isn’t, and thus doesn’t correlate as strongly to corn. In addition, soy is harvested a few months after the main US wheat and corn harvests, resulting in a delay in the convergence of the crop’s relative prices, which could be exploited by market participants.
For example, at the beginning of 2014, the market was focused on the tightness of the old crop in soy, which dragged the price of the new crop up, in spite of strong fundamentals and predictions of record yields. This was reflected in an inverted soy futures curve. The dislocation generated a very attractive trading opportunity, as the market started realizing the record yields for this year, bringing the price of soy down considerably. In fact, the latest USDA report increased this year’s yield estimates for the third consecutive month for both soybeans and corn. The soybeans harvest is expected to be 3.9 billion bushels, 17% higher than last year, while corn harvest estimates came in at 14.4 billion bushels, a 4% increase from last year. The resulting change in the soy and corn contracts is staggering: the soy November 2014 contract, as of 10 October, is down 18.7% this year, while the corn December 2014 contract is down 25.8%.
The incentive to plant soy will likely continue, further solidifying a record crop year, unless weather in South America seriously impacts the continent’s soy production. Moreover, with farmers in Argentina already holding their stocks to hedge against inflation and FX control policies, a solution to the gap between the black market and official rate would bring additional supplies to the market. Fundamentally, for these reasons, the relative price of soy looks very expensive to corn and should come down a few hundred cents closer to corn. In spite of the magnitude of the sell-off, implied levels of volatility are very low, leading to cheap option prices. For sophisticated investors looking to take advantage of commodities dislocations, options at these levels could be a good way to structure the investment and to help mitigate part of the risks – for example, weather-related risks.
Although cross-commodity spreads can appear to be less risky than directional trades, they are not. The two-year daily correlation for wheat/corn has been 0.52, while for soy/corn it has been 0.47, which doesn’t show great stability in the relationship. Correlations between two commodities may break, moving the two legs apart and causing losses to the trades. In this annual cycle, soy is the last crop standing; judging its ultimate strength versus its earlier contenders will require skill and hard work.
- Explore Categories
- Commentary
- Event
- Manager Writes
- Opinion
- Profile
- Research
- Sponsored Statement
- Technical
Commentary
Issue 98
The Last “Crop” Standing
Soybeans look expensive relative to other agriculturals
MAYER CHEREM, CFA, CQF, MANAGING DIRECTOR, PAAMCO
Originally published in the October 2014 issue