One of the key arguments and most often cited explanation for the rise in popularity of beta investment products has been investors’ reluctance to pay the higher fee structure typically charged by active managers. Although time will tell whether this migration towards beta fund investing is prudent, it certainly raises further questions about the current investment landscape. Many investors may be disgruntled not only because of underperformance relative to fee structures, but also because of a lack of transparency tools and possibly manager failure at successfully demonstrating exposures and expectancies of when a strategy should out-perform or under-perform and why.
The trend following industry has seen an influx of beta offerings. Whilst the downwards pressure on fee structure is arguably very good for investors, it may come at a significant cost as investors opt for low cost investment options that have performed exceptionally well during recent market crises, but may not offer investors sufficient insight into the attribution of that performance – thus leading to potential skewed risk exposures for investors.
This article is based, in large part, on the findings of our study ‘The Long & Short of Trend Followers’ (2016) that examines the hidden risks with trend following and the most dominant determinant of CTA strategies’ returns. In our study we create a trend following replicator that has a higher explanatory power of CTA returns than do leading studies on the subject such as Moskowitz et al (2012), thereby offering investors significant insight into the components of CTA performance and providing a foundation for further studies. A decomposition of portfolio components is beneficial to investors for a number of reasons, including: to evaluate the performance attribution, macro risk exposures, beta and diversification values associated with each portfolio component.
With interest rates at 5,000-year lows the extremes of the past 30 years have shaped our definition of an investment crisis as one that typically sees equity markets fall along with falling bond yields as investors rush to perceived safe-haven investments. How much of CTAs’ performance, commonly seen as a low-correlation, highly beneficial diversifier during market stress, can be attributed to this behavior? According to our study based on research dating back to the inception of bond futures contracts – quite a lot.
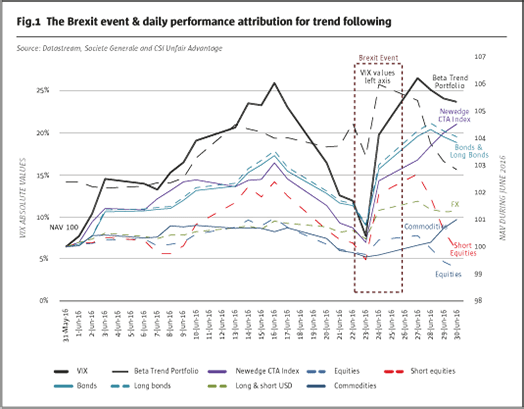
The immediate market reaction to the prevailing Brexit leave vote saw the VIX soar by 50% on a daily basis during June, its highest level since January. In both of these periods, CTAs outperformed other strategies, serving their purpose as diversifiers in institutional portfolios. Some CTAs were up more than 10% during June, helping investors suppress the impact of a crisis event on total portfolio performance. During this type of market crisis CTAs have generally been excellent sources of diversification. Fig.1 shows the attribution during Brexit from our CTA replication program, the Beta Trend. Note the performance attribution that shows CTA return drivers are from bond exposure and to some extent, FX. A recurring theme during market crises has been positive performance attribution by long bond positions, which is an extremely attractive characteristic of trend following portfolios, but it is also important that investors are able to study accompanying risks to ensure they are fully accounted for.
The long and short of it
By dividing the trend-following strategies by asset class, then further into the long and short of trend-following strategies, as depicted in Fig.2, our analysis reveals important asymmetry in performance expectations. For the FX sector we decompose exposure into long and short relative to the USD for a basket of six major currencies. Our study is simply one approach and there are many others that may help investors form a foundation for further studiese.g. researching the impact of carry on trend following.
Our evidence shows that the long legs of the trend-following strategies generate positive performance in the long term while the short legs fail to generate any significant positive long term performance. A coincidental bias in the actual bond futures data is that it does coincide with a 30-year bull market in bonds and so one would not expect a strategy to profit from short positions, but a critical determinant on the return of bond futures is the slope of the yield curve or the expected roll yield. Campbell (2013) shows in ‘Prospects for CTAs in a Rising Interest Rate Environment’ that the roll yield is almost always positive with brief inverted spikes, thus there would generally be a large carry cost associated with being short bond futures.
Active positioning in the long and short legs of each asset class varies and the historically long bull markets results in longer positioning duration for long signals than shorts. The bursting of the Tech Bubble and the Financial Crisis are examples of when short equity signals have created valuable diversification benefits and there have also been instances when short bonds have created brief periods of positive return, but then reverting to a negative result upon the full cycle of the position being stopped out. Trend following is slow to react but for extended market crises with favorable absolute and relative interest rates short signals have proven to be effective diversifiers.
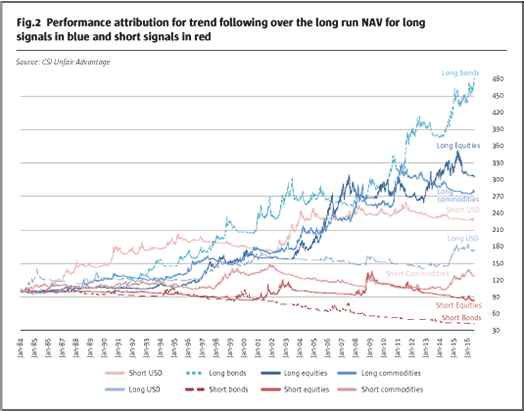
This chart (Fig.2) can nevertheless explain style drift and an understandable appetite to offer an unbalanced exposure to the long side of the portfolio. This is further nourished by investors’ appetite for high returns, a scarce resource in a low interest environment.
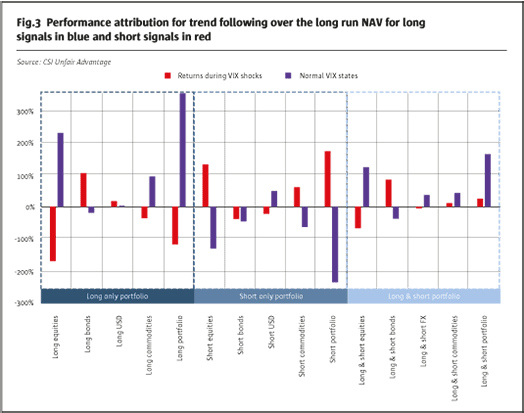
Taking into account the asymmetry in the long and short returns of the trend-following strategies enables a more exact analysis of the performance attribution of CTAs in equity market crisis events, which are typically accompanied with a sharp increase in VIX and a fall in yields. Taking a closer look at the performance attribution of the trend-following program by the long and short positions in different assets during VIX shocks shows that CTAs offer what is referred to as Crisis Alpha, positive performance during crisis states. Fig.3 shows that the long bond component is an important factor for positive crisis alpha.
Although the equity market volatility signals the state of the overall market, it does not imply how the risks are propagated in a more complete spectrum of assets. Considering the bond market, a sharp increase in government bond yields can be an equally valid portfolio crisis impact that investors may seek to be diversified from.
The most recent experience of such a market event was Bernanke’s announcement of the tapering of the quantitative easing of the Federal Reserve in 2013, which sent the 10-year US government bond yield from low levels of less than 2% to reaching 3% within a year.
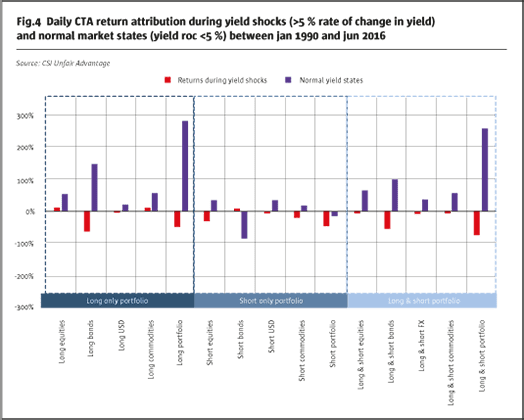
Fig.4 presents the performance attribution of the trend following program in the normal and volatile shock states of the bond market, which we define as over 5% relative jumps in the 10-year US government bond yield. These statistics are striking and demonstrate that the performance of the trend following program is negatively exposed to bond market shocks.
The value of transparency and decomposition
Some studies have already examined the likelihood that CTAs will have a positive expectancy during rising rates, but our analysis has shown that crisis alpha investing in CTAs has a twist of exposure to bond market shocks. For investors in CTAs, the inclusion of CTAs may in many cases lead to excess exposure to changes in interest rates. Therefore, the diversification effect that investors’ long bond exposure has historically offered, both from direct physical bond exposures and from CTAs, should not be taken for granted. The issue expectedly gathers more attention too late when the bond market trend reverses whilst the performance of many CTAs potentially disappoints. The lurking danger of the lucrative habit of generating Crisis Alpha through long exposures should be taken to the fore of portfolio management.
While central banks have been very vocal about their commitments to keep interest rates low, it is by no means given that yields will remain low for an extended period of time. Recognizing these risks may help convince investors to request and work with the transparency provided by their managers – both from active managers as well as beta funds. Pursuing further research on insights may yield attractive results.
The second take away from this study is that long positions for trend following strategies are highly related to total returns, particularly so for equities and bonds. Applying this type of analysis enables components to be ranked based on their return expectancy and beta exposure. Investors can evaluate if beta correlated components within a strategy add value to an investor’s total portfolio and if so perhaps it should serve as replacement within that asset class rather than an addition. The additional capital that was originally reserved for strategies producing alpha or diversification could then be deployed elsewhere. Greater insight offers investors an opportunity to evaluate the current allocation process to determine if there is a better, more holistic, approach. As many managers already provide granular data for investors we hope our study may encourage investors to utilize this information as it may help evaluate macro risks and beta exposures associated with the strategies and better align traditional and alternative exposures.
With over $13 trillion of the bond market in negative yield territory (as of August 2016) it is important that investors and fund managers align interest soon to protect the very system that has been created with expected capital appreciation in investments for pensions, insurance and savings.
- Explore Categories
- Commentary
- Event
- Manager Writes
- Opinion
- Profile
- Research
- Sponsored Statement
- Technical