UBS houses a wealth of fund management expertize and UBS Equity Opportunity Long Short (EOLS) is now the third UBS-branded or affiliated UCITS hedge fund that The Hedge Fund Journal has profiled in 2015! We previously flagged up the launch of the multi-strategy O’Connor Opportunistic UCITS and then the opening to external capital of the UBS Global Equity Long Short UCITS (GELS). All three of these products have separate managers, sitting in separate offices.
UBS EOLS lead manager Max Anderl (pictured above) recognizes that his heritage is in long-only equities, which he has managed at UBS since 2000. Anderl, who grew up in the mountains of Austria, originally trained as a biochemist but moved out of the lab and into UBS after an MBA provided his first taste of financial markets. He later became a CFA Charterholder.
Anderl heads the Concentrated Alpha Team and his first long-short product – UBS European Opportunity Unconstrained (EOU) was an “extension product” – a 130/30 mandate launched in 2007 that has become one of the most successful European equity funds and attracted €4 billion of assets. This is a relative-return product that has generated alpha on both long and short books, with more alpha coming from the short side over the past few years – though Anderl admits that the short side was tough for the first couple of years. Having cut his shorting teeth on the 130/30, Anderl in 2010 resolved to launch an absolute-return product. EOLS was seeded in-house by UBS and run internally until 2014 – with a market-neutral approach. But when UBS opened the strategy to outside capital, conversations with investors and the team’s quantitative analysis suggested that a product with a variable directional bias would be more appealing. The big surprise, perhaps, is that volatility of the strategy actually dropped when it shifted to being directional from market neutral!
Capital preservation
Now the default stance is to be 50% net long but net exposure can range from -0.25 to +0.70. Gross exposure can reach 250% but has so far ranged from 170% to 200%. UBS uses a multi-factor quantitative model, with inputs including valuation spreads, the credit market, sentiment and volatility, to help determine the net exposure, but managers also exercise some discretion to adjust the net within broad ranges dictated by the model. Reflects Anderl, “historically the indicator has been good for big moves, such as the 1987 crash, the 1998 emerging market crisis, the 2000 TMT bubble bursting and the 2008 Lehman failure,” as shown in Fig.1.
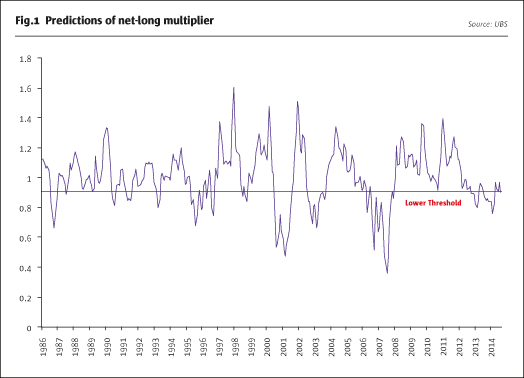
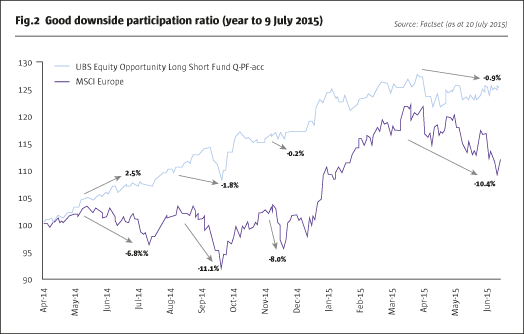
But no model is perfect, and Anderl observes, “the model gives two or three sell signals per decade and in fact you tend to get one big bear market each decade, so there are some false alarms” – but far fewer than those thrown up by the VIX index, which Anderl reckons gives “thousands of false alarms.” As well the model tends to be about six months early, but Anderl does not mind missing the very last leg up of a major bull market in order to avoid the violent lurch down in the beginning of a bear market. Additionally Anderl acknowledges that the indicator does not necessarily anticipate smaller falls, such as the three pullbacks of between 7% and 11% seen in 2014 that were associated with panics over Syria, Ukraine, and Russia. During those types of reversals Anderl’s sector and stock-picking can come into play. Fig.2 shows how in 2014, the fund lost less than 1% during the three episodes when Stoxx 600 lost between 7% and 11%.
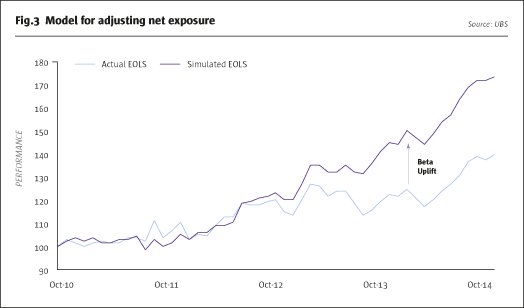
The indicator has been consistently net long since 2010, between 30% and 50%, but a UBS simulation still suggests the absolute return strategy would have made money over 2011 – with substantially less volatility than the old market neutral approach. The fund had demonstrated some impressively uncorrelated returns in market neutral mode, making 6% in September 2011 against a falling market, but the following month the fund lost 5% in an up market.
Alpha and beta mix
In market neutral format between 2010 and 2014 EOLS delivered alpha of 28.2% and beta of 7.6%, according to UBS estimates based on inferred factor exposures. Going forward Anderl expects EOLS to show a somewhat more even balance between alpha and beta, but he still expects alpha to predominate over time. To estimate how the fund would have performed before May 2014 with its current equity beta appetite, performance shown below simply adds back the beta exposure, on top of the market neutral returns.
Now “we are happy if we can preserve capital in a down market,” says Anderl, and that is what he has achieved in 2014. As an absolute-return product, EOLS targets returns of 8-10% through a full market cycle, with volatility of 10% whereas EOU aims to outperform MSCI Europe by 3-5% per year, which implies some tolerance for losses during bear markets. Since 2007 EOU has surpassed its own outperformance target, making over 100% against an index up around 20%. The long books of EOLS and EOU have a very high overlap, and have been driving returns in 2015.
European equities started 2015 with their best quarter since 2009, and Anderl views this as a rational response to Draghi’s QE, reducing the cost of capital and the Euro exchange rate. But Anderl is still strategically timing the market and adjusting his exposure. Judging that the rally was overstretched in April, he decided to scale back net exposure to 30% from 50%. Then, when we met in July, he was starting to add back long exposure and buy back some shorts.
Sector views
The fund typically has 80% in Europe and up to 20% outside, but this could go much higher. Anderl observes that many companies listed in Europe are really global multi nationals. “Nestle and Unilever are not European companies and Apple is as global as Unilever.” In particular he points out “the European IT sleeve is very thin and can become overvalued due to scarcity of value.”
Geographic weightings are thus a consequence of bottom-up stock picks and Anderl does not take macro views on markets, (though he has not had any exposure to Greece, either long or short). Anderl points out that, “the UK has been the strongest economy in Europe but also had the weakest stock market – because the FTSE is nothing to do with the UK economy.” Yet the fact that other investors are taking a top-down approach can generate opportunities for Anderl. Earlier this year he thought investors or perhaps index flows were leading to indiscriminately exuberant rises in share prices of Italian firms, even when fundamentals for some were weak.
One recurring theme for Anderl has been sustainable dividends, and he is at pains to distinguish these from high dividends per se. Two examples are Unilever and Novartis. Both of them yield around 3% and Anderl observes that this is clearly much higher than ten-year government bonds in any major European country. Anderl argues that “even if Novartis dropped 25% over 10 years, investors would still break even versus buying and holding a ten-year government bond” – and that analysis assumes the dividend is constant. In fact Anderl expects these companies are “more likely to raise the dividend, and have better balance sheets, more diverse income sources and less volatile free cash-flow generation than do tax revenues.” For Anderl the “bond proxy” argument is a very real one.
Does Anderl’s experience as a biochemist explain why healthcare is the largest net long? Absolutely not – between 2003 and 2008, he was actually underweight the healthcare sector and finds it “tough to analyse.” In particular Anderl avoids binary, one-product companies. The real reason for the healthcare exposure is that in 2013, Anderl had rotated his defensive allocation away from consumer staples, which had reached valuations of 18-19 times earnings while pharma was on 15 times. Even so, Anderl is alert to the risk of patent cliffs, so he chooses well-diversified names. “Novartis is a little below 50% non-Pharma (patent-related business) with plenty of eyecare, consumer and generic exposure so most single products are below 4% of sales.” US-listed healthcare names owned include pharmacy CVS and hospitals group HCA.
Financials are the second largest sector net long because “banks are becoming utilities with good risk versus reward.” Harking back to the 1980s Anderl observes that banks were once defensive investments. “Before they became investment banks, the banks paid decent dividends and could outperform in falling markets.” Having turned into all singing, all dancing, leveraged firms, they have now come round full circle and are once again boring, low leverage, high dividend names. Financial names that appear in Anderl’s top ten holdings include Sweden’s Nordea, Finland’s Sampo and the UK’s Aviva.
Structural and opportunistic shorts
Longs and shorts are intended to be independent profit centres, with very little pairs trading done and index futures are only occasionally used to balance the books as a matter of urgency. One historical shortthat Anderl can discuss was Frontline, and this came under the heading of “structural” shorts that face fundamental challenges to their business model. “In 2010, analysis suggested that the industry was ordering too many ships in the strong years of 2005 to 2007, leading to oversupply when these ships finally got delivered. Frontline was particularly vulnerable to oversupply as it had the weakest balance sheet,” recalls Anderl. Eventually, Frontline lost as much as 90% of its value. Anderl also uses more opportunistic shorts, and here one example was “a consumer discretionary stock where expectations had run wild.” Anderl was able to cover the short down 40%.
EOLS has done particularly well out of energy shorts. In 2014 Anderl became bearish on capital spending and put on oil service shorts. He has now covered some names and shifted into shipbuilding companies, and exploration and production names that have higher valuations and more downside.
Position sizes have an absolute hard limit of 3% for shorts whereas longs could in theory reach 10% under UCITS rules. The cap is lower for shorts because “in 1980 if you shorted Microsoft it would have killed you whatever else you did.” In practice position sizes tend to range from 1.5% to 3% on both sides of the book.
Nimble decision making
Anderl pulls the trigger for buy and sell decisions, though he is informed by analysis from in-house and external independent research providers. Within the team there are two dedicated deputy portfolio manager/analysts who review holdings and may alert him “if the risk reward is no longer good or if the investment thesis has changed.” Anderl argues that this streamlined decision making process avoids committees which can slow down responsiveness to rapidly changing markets. He finds “small teams are more efficient and effective at decision-making,” partly because the future is so hard to predict. “Nobody would have foreseen what is happening in Greece today and in 2014 nobody forecast an oil price of 60.”
Anderl has access a wealth of internal and external expertize. Inside UBS he can access fifty analysts, which are shared with other UBS teams. They include local European and local US teams, as well as Asian teams. Outside UBS Anderl is choosy about who he works with. “We only use research providers that measure their performance in some way,” he says. Anderl prefers the use of IRPs (Independent Research Providers) instead of paying commission; he will pay them directly for research – not least since some IRPs have no brokerage arm anyway. Anderl does not always find analysts from the big investment banks particularly useful as their typical time horizon, of 3-6 months, is shorter than his average holding period of two years on the long side (his shorts do in fact have somewhat shorter holding periods of 6-12 months).
Multi-dimensional process
The EOLS process is multi-layered. It may start with standard quantitative valuation analysis, but then goes on fundamental modelling and to softer qualitative factors such as management incentivization. Here Anderl laments that “many firms in Europe are not concerned for shareholders, they have other motives.”
Amongst fundamental models, Anderl deems the Credit Suisse HOLT system particularly useful for scenario analysis, as it can “map out 10 outcomes with a user friendly tool,” says Anderl, who finds this helpful as he is a “picture-driven person who wants to turn that screw and immediately see what happens to valuations, sales, margins, and asset turnover.” HOLT covers 15,000 companies but Anderl does not place too much reliance on any single analytics package because he says “it is not a crystal ball.”
Anderl is equally exact in his choice of quantitative models.“We spend a lot of time identifying good models and in particular contrasting ones. We deliberately seek out disagreements between models.” Some of the models are focused on growth and others on value, which provides different angles for looking at the 6,000 stocks that UBS keeps quantitative profiles on. As well as shorter-term models with a multi-month time horizon, longer-term ones with a multi-year perspective add variety to the mix.
Corporate governance and socially responsible investment ratings, from providers such as ISS and GMI Ratings, covering 8,000 companies, all form part of the qualitative analysis. “We want to see how much power management has to issue shares, how management are incentivized, how long they have been there, which boards they sit on and work out how capital allocation is important for creating value.” Boardex is another information provider that takes the board seriously and assesses chemistry and longevity amongst senior management and on the board, which can help to detect early warning signs with some 300,000 individuals monitored.
EOLS in-house assets of €50 million have already quintupled to €250 million, and the inflows are coming from diverse sources. “High net worth individuals forced out of bond markets, institutional investors like pension funds, and hedge fund of funds” have all been allocating. When Anderl talks about bond markets he means high-yield credit as well as government bonds, as both of them have historically low yields but escalating volatility in 2015. As a UCITS the product is available to retail investors with euro, USD, GBP and CHF share classes on offer. Non-euro share classes hedge euro exposure. “We would like to talk to more UCITS funds of funds as they are growing,” says Anderl, and stresses that the product is generating alpha on top of the beta. Anderl sees capacity of at least $1 billion for the strategy, and thinks this might go even higher if he increased the global sleeve.
- Explore Categories
- Commentary
- Event
- Manager Writes
- Opinion
- Profile
- Research
- Sponsored Statement
- Technical