Implied volatility has receded substantially across a range of markets including government bonds, equities, currencies and precious metals since peaking in March. In some asset classes, implied volatility has returned to the historical lows of the pre-pandemic period. For many others, while implied volatility is well off its March highs, it remains notable.
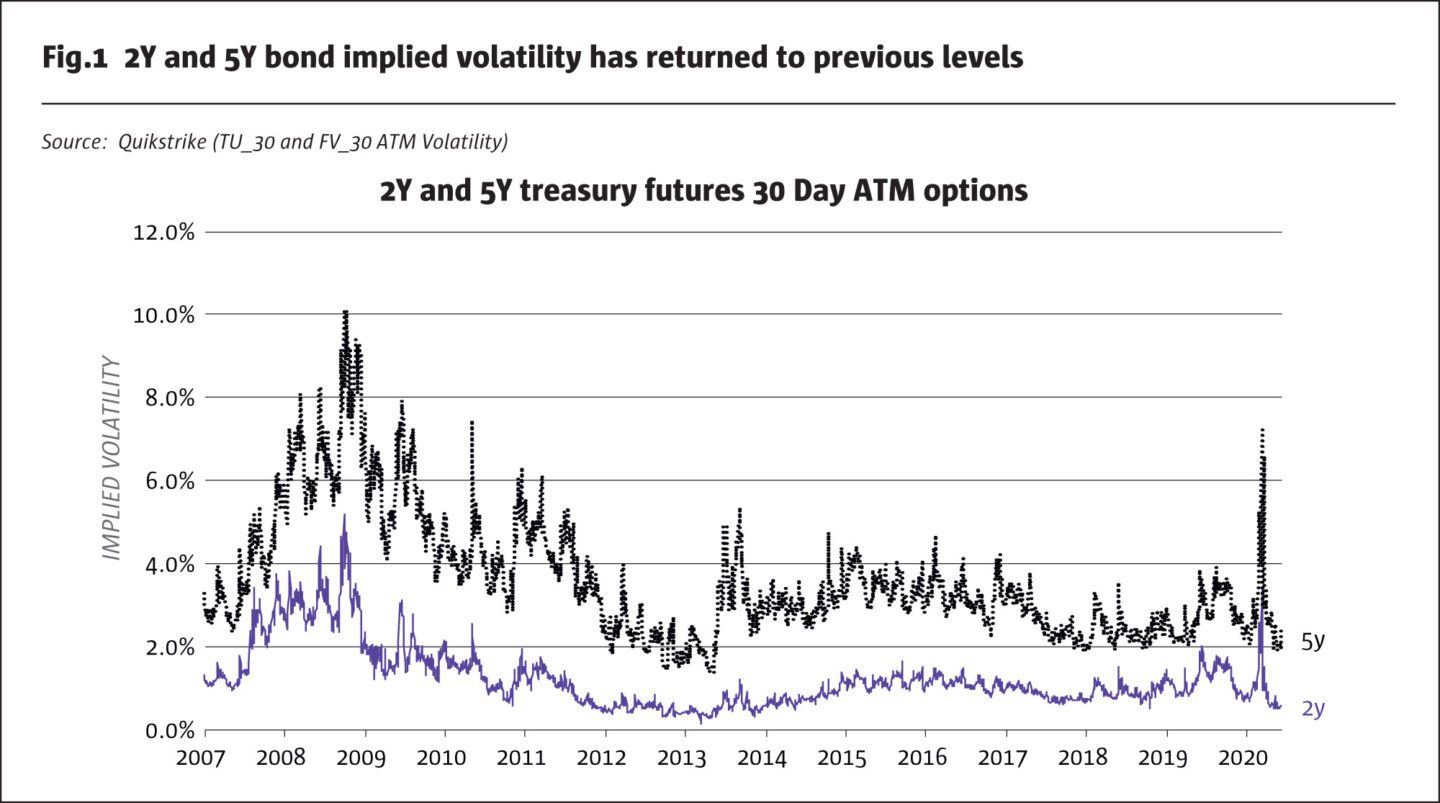
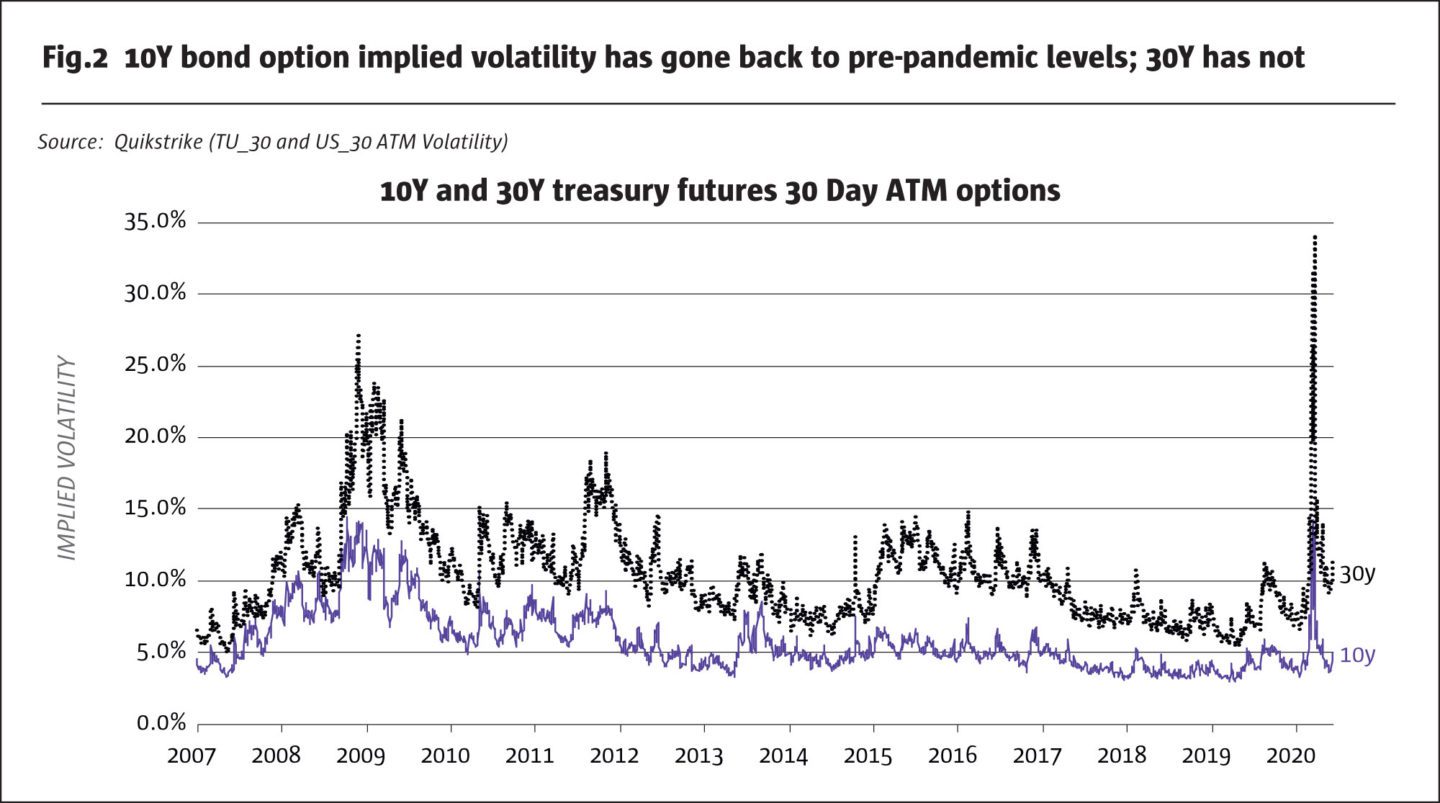
Implied volatility has returned to previous lows on the US government bond yield curve for maturities of 10 years and less (Figures 1 and 2). By early June, 2Y, 5Y and 10Y bond options traded close to levels last seen in December and January before the pandemic reached US shores. This is not surprising given that the Federal Reserve (Fed) controls short-term interest rates directly. By signalling that it intends to keep interest rates low as the economy recovers, the Fed has reigned in short-term interest rate volatility by reassuring investors that rate hikes are not at hand. Additionally, the Fed’s aggressive buying of government bonds via quantitative easing (QE) has also helped to contain volatility.
By contrast, implied volatility on 30-year maturities remains significantly higher than before. While the Fed can reassure markets that it will keep rates low for an extended period of time, those reassurances lose their impact beyond the 10-year point on the curve. Moreover, while the Fed does buy some extremely long-dated debt, its QE purchases probably can’t absorb the enormous supply of long-dated Treasuries coming to market as the US budget deficit is expected to grow from 5% to perhaps more than 20% of GDP in the coming months. While options investors at the short-end of the yield curve appear reasonably confident in the ability of the Fed to keep a lid on 2Y, 5Y and even 10Y yields, that confidence doesn’t extend to the 30Y bond (Figure 2).
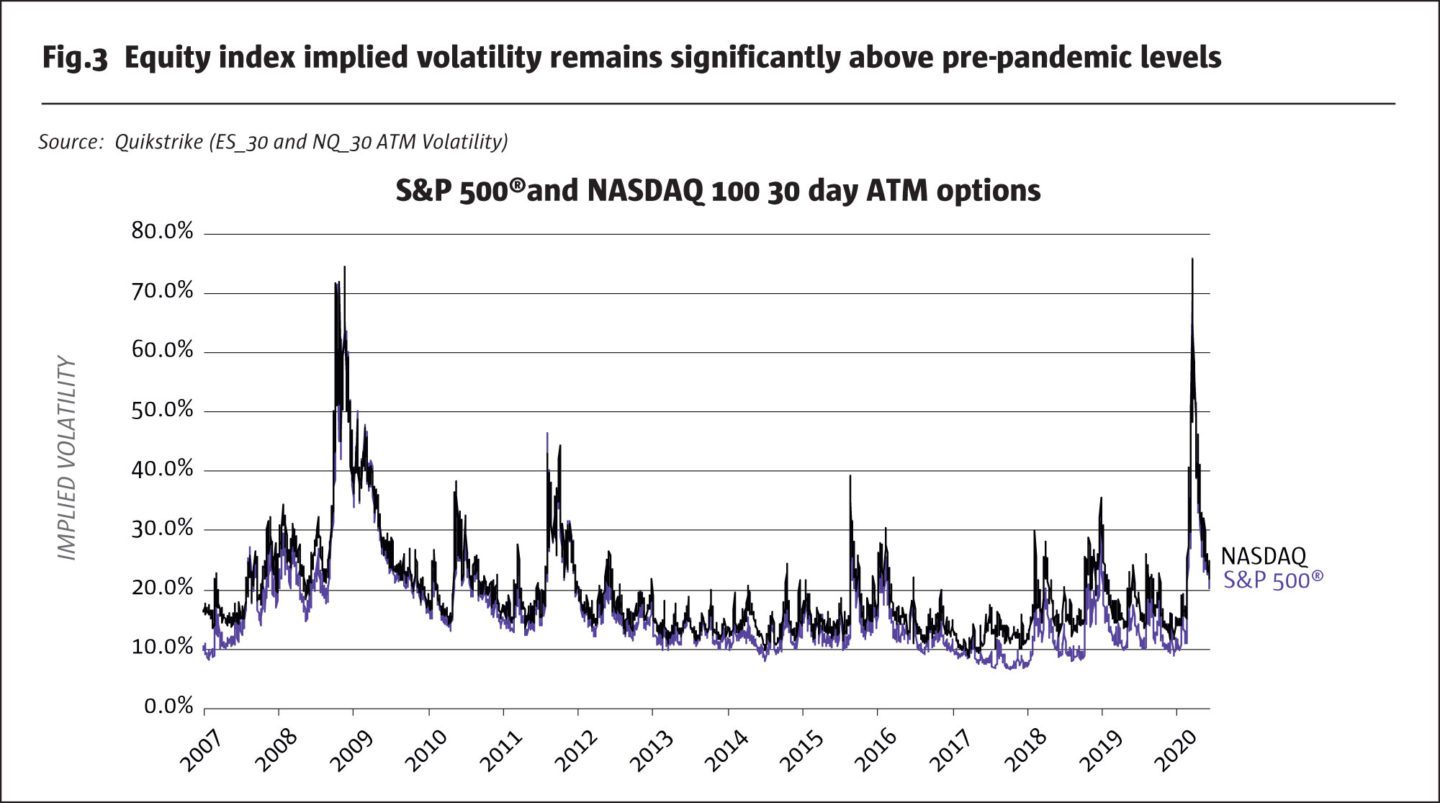
Perhaps not surprisingly, options on equity market indices such as the S&P 500® and NASDAQ 100 remain far above previous levels as well (Figure 3). Although they have fallen dramatically from their March highs, they remain at levels 2-3 times their pre-pandemic lows. It’s important to point out as well that not only is equity index implied volatility roughly 2.5 times what it was pre-pandemic, but that it remains at elevated levels despite the equity market having recouped most of its February-March losses.
To the extent that the equity market attempts to discount the value of future cash flows into the current situation, the high volatility on equity index and 30Y bond options may stem from the same source. A large portion of the equity market’s rebound may have come from the plunge in long-term bond yields which raised the net present value of future dividends, earnings and other cash flows.
Even more simply, the fall in bond yields across the curve has made fixed income less attractive relative to equities and other investments. Hypothetically, were yields on 30Y bonds to rise sharply, that could remove an important underlying support in the stock market.
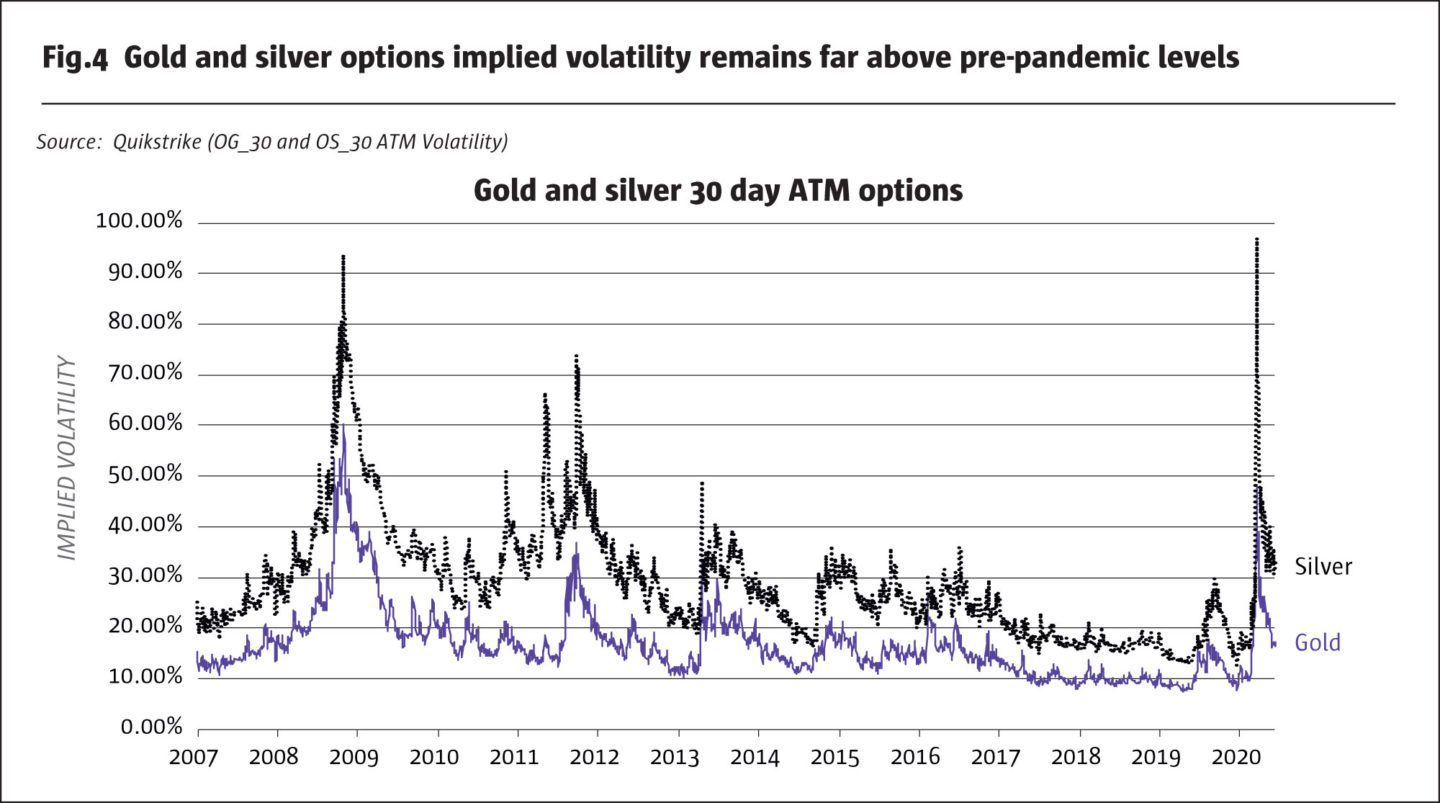
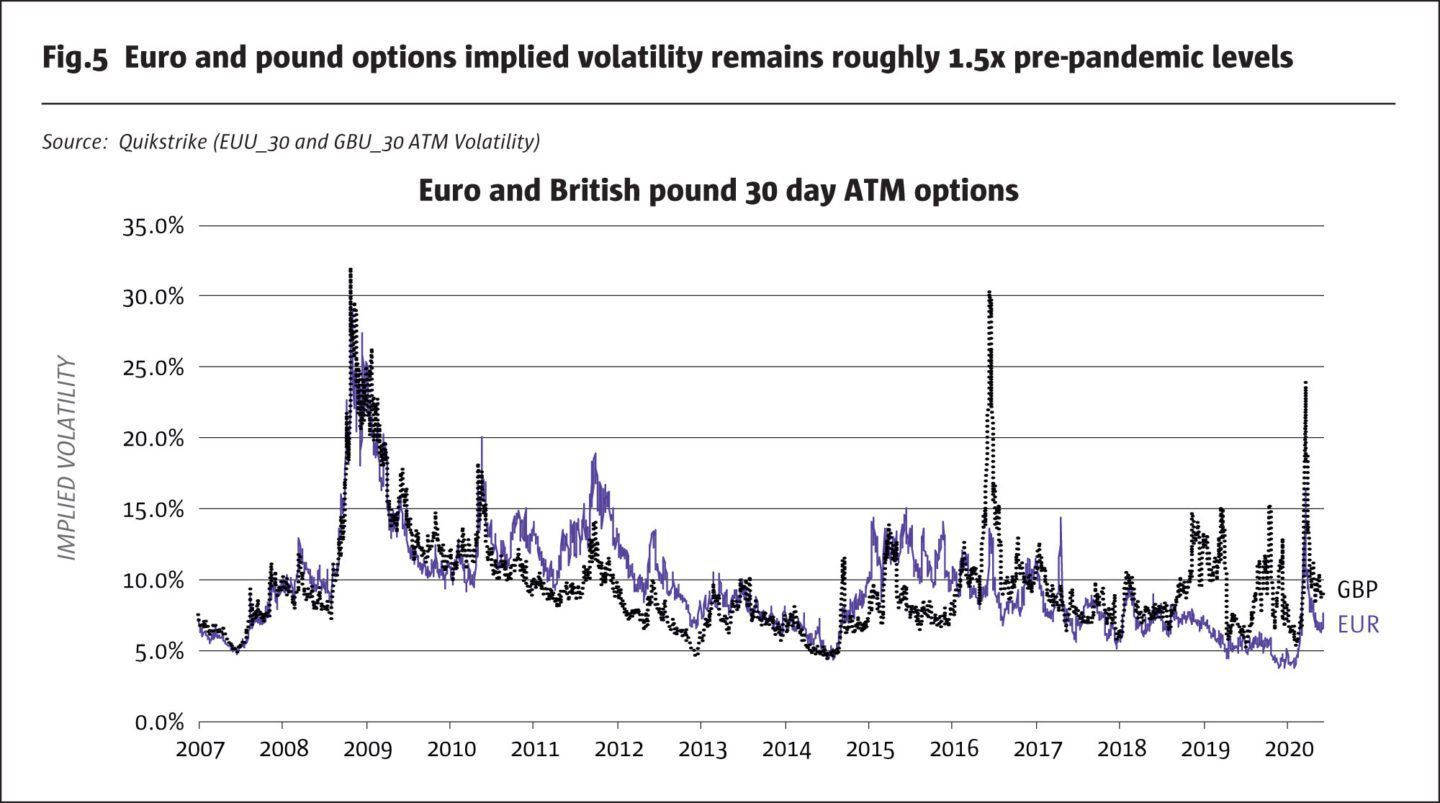
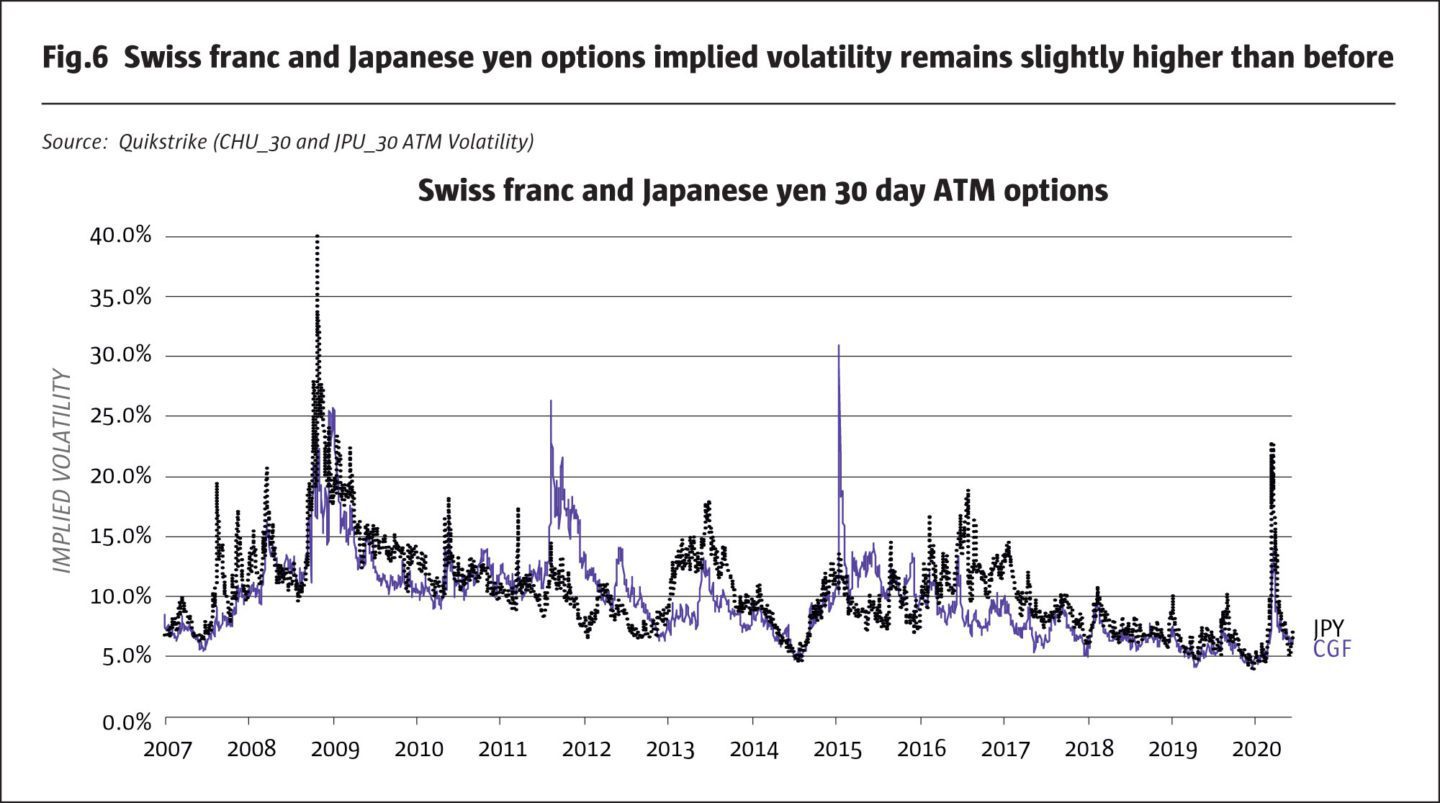
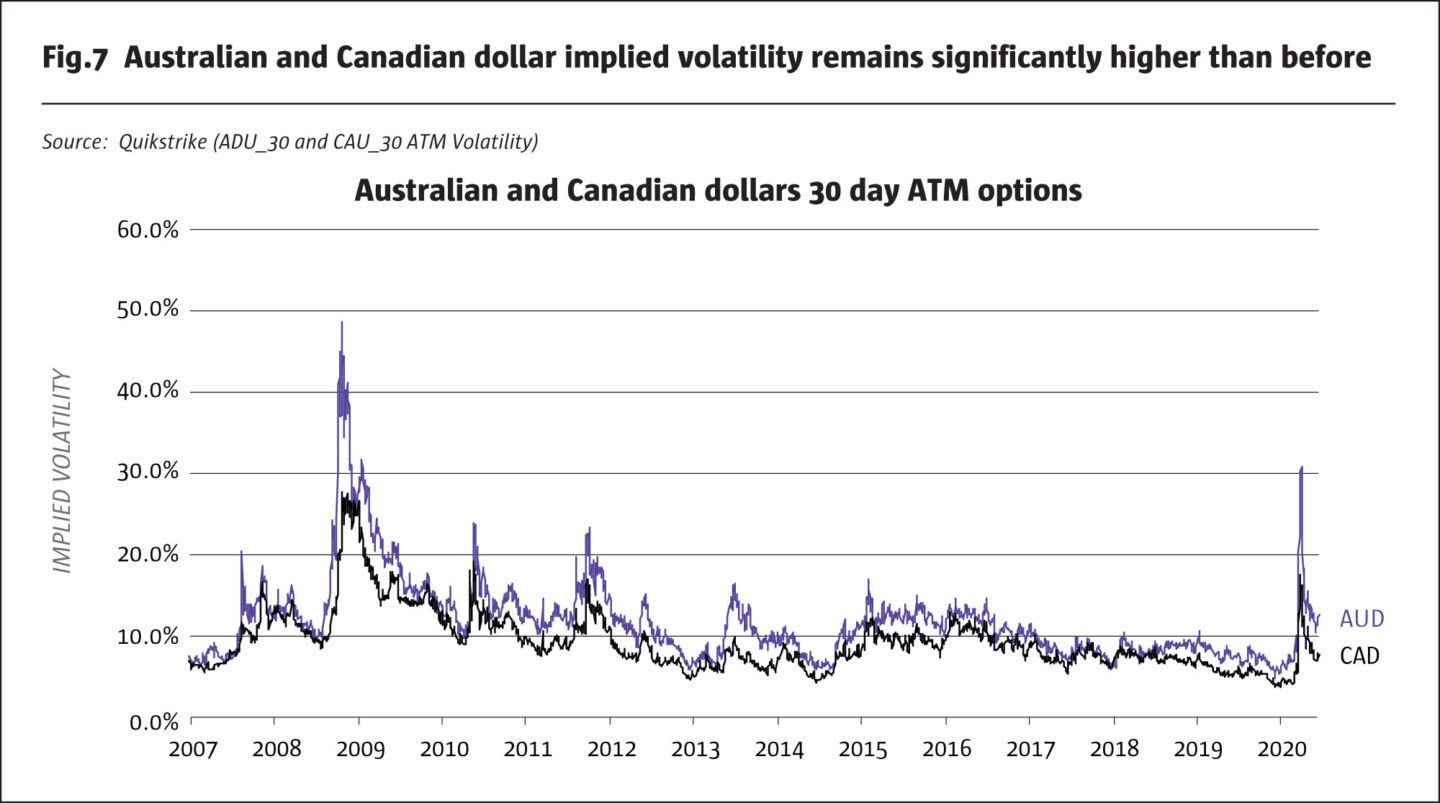
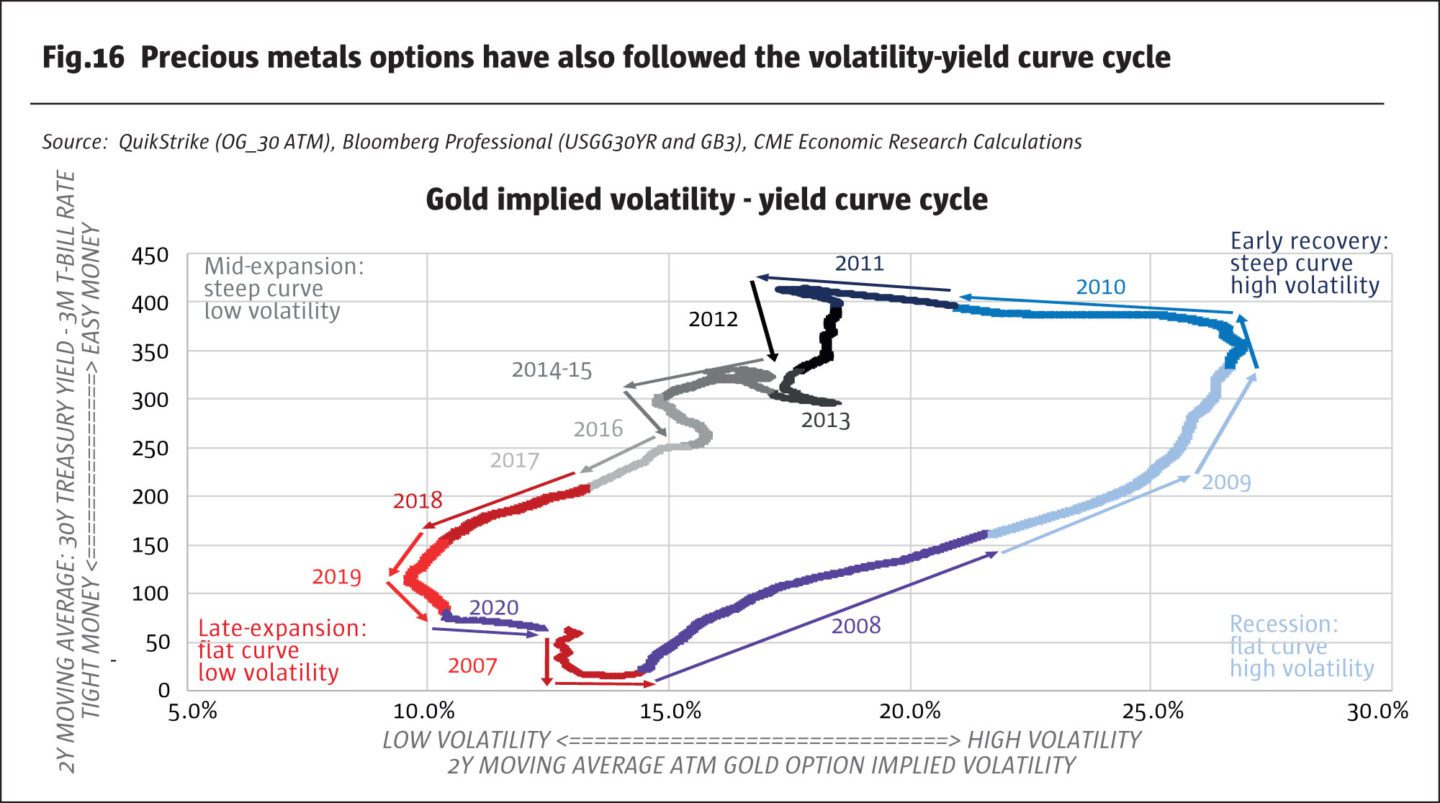
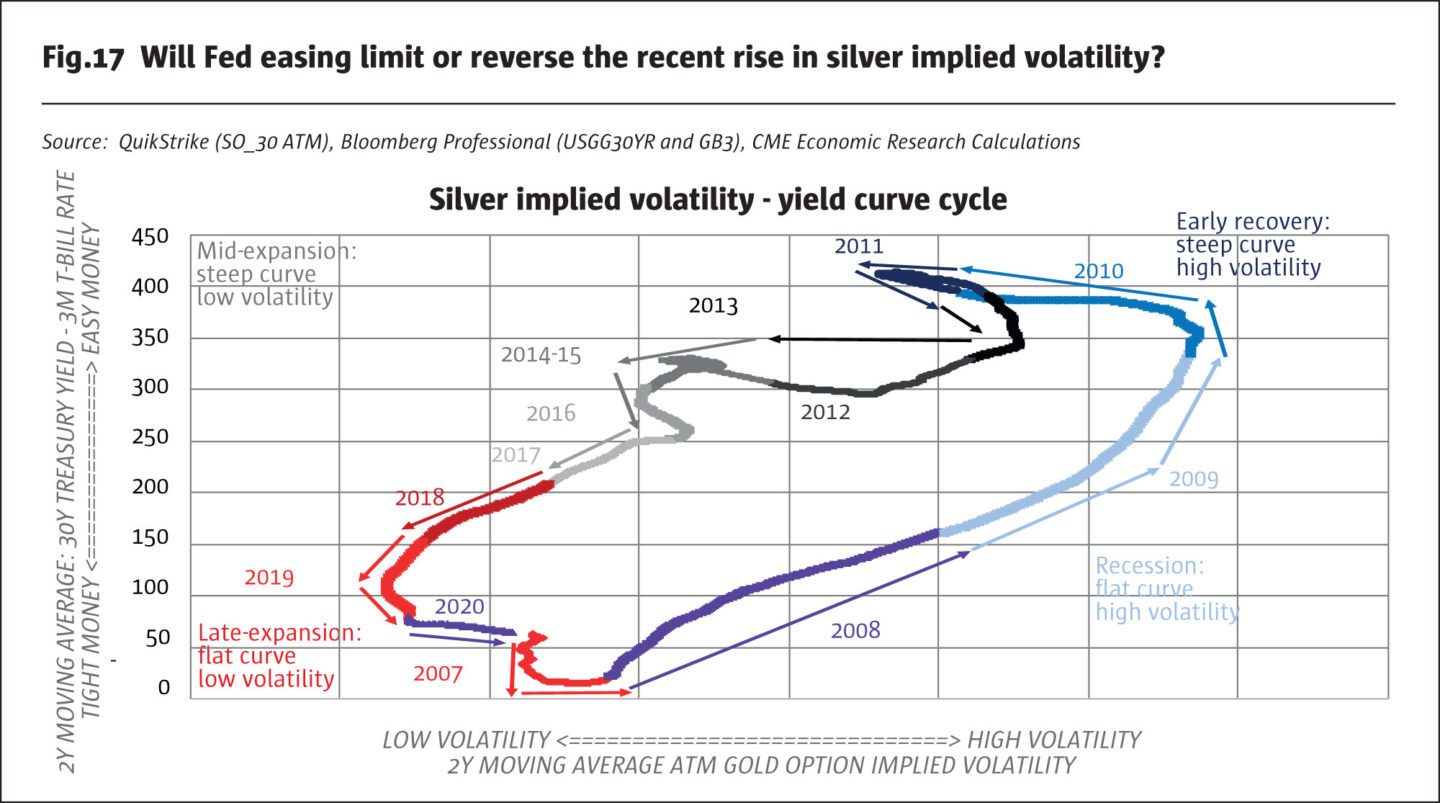
For precious metals and currency markets it’s a similar story. Like equity index futures and 30Y government bonds, implied volatility on their options, while well off recent highs, remains far above previous levels (Figures 4-7). Like equities, gold and silver also react to interest rates. Both can be viewed as quasi-currencies that tend to benefit from falls in interest rates. Precious metals are also sensitive to QE. The first two rounds of QE in 2009 to 2011 sent gold and silver prices soaring. Investors should be warned however, that QE3 didn’t have the same effect in 2012 or 2013, especially once it became clear that the Fed intended to taper its asset purchases.
There are, of course, the broader questions. How does the Fed and other central banks view the level of volatility, realized or implied, in financial assets? High levels of volatility in financial assets can restrain economic growth. Implied volatility on options is, after all, a reflection of investor uncertainty of the future. The less certain investors are about future economic and financial conditions, the harder it becomes for them to commit capital to long-term projects. Additionally, for companies wishing to access the capital markets to raise equity or debt capital, rapid price movements and wide swings in prices make it more difficult to raise money.
As such, it’s not surprising that over the past three decades, the Fed has tended to limit volatility with easy monetary policy when faced with economic distress. This approach appears to bring down volatility by injecting liquidity into the financial system. When there is a great deal of liquidity in markets, buyers and sellers transact easily and large orders can be executed with little price impact. If prices don’t have to move much to get orders filled, volatility tends to subside.
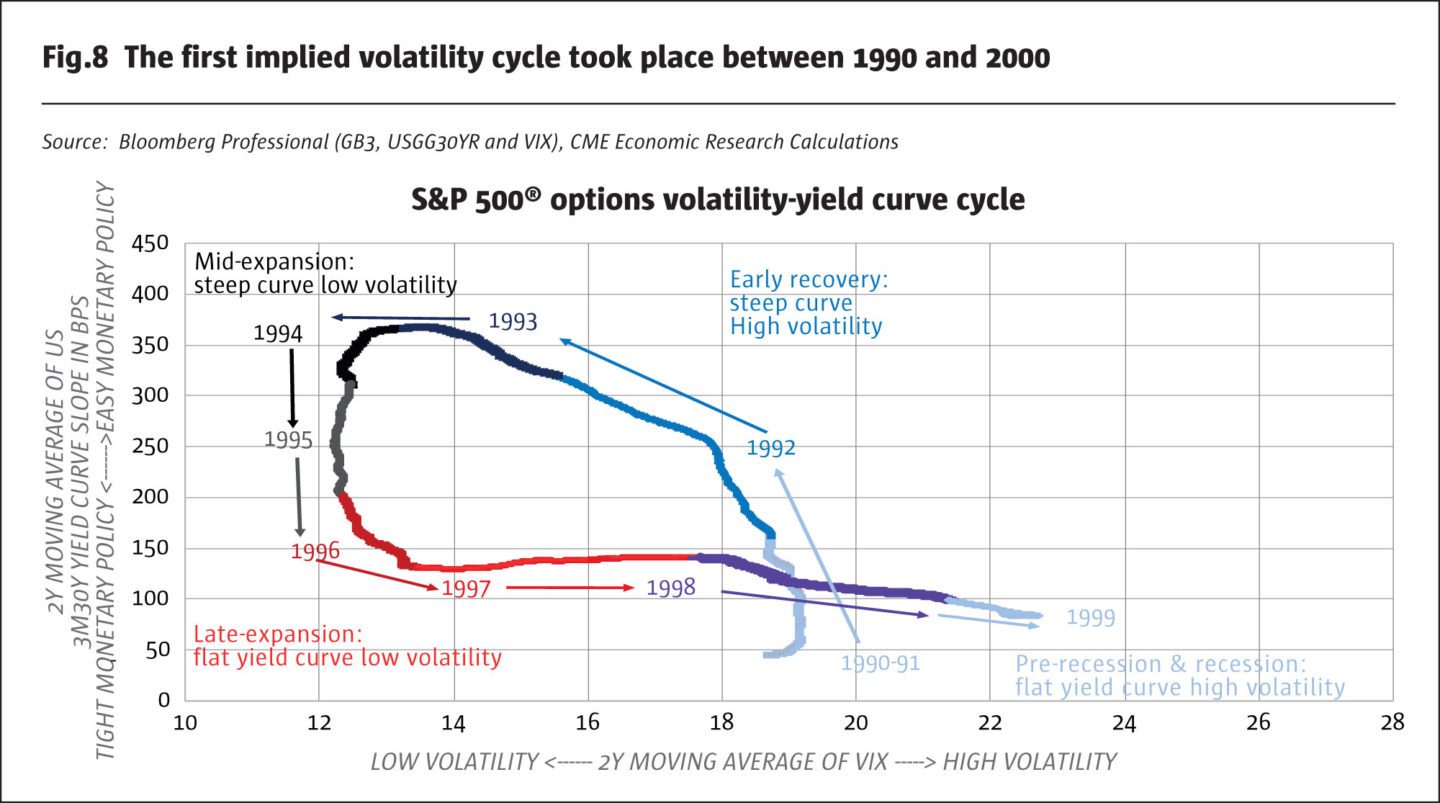
Over the past three decades we have witnessed three complete cycles in the relationship between monetary policy and the level of implied volatility on equity index options. To more easily observe this cycle, we look at the two-year moving average of implied volatility and two-year moving average of the difference between 10Y bond yields and 3M T-Bill rates. The cycle breaks down into four parts:
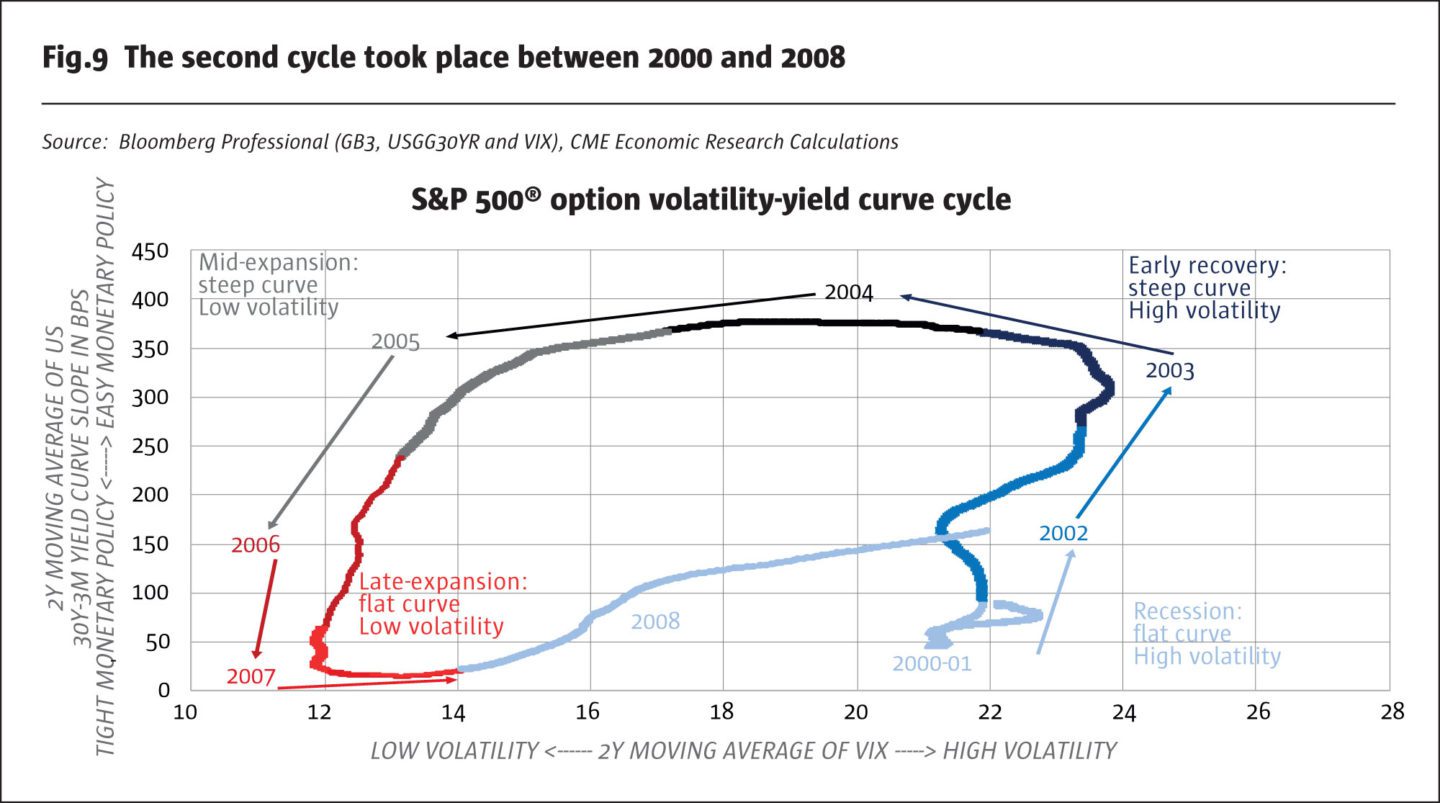
- Recession: recessions tend be characterized by high and rising levels of volatility and are usually preceded by exceptionally flat/inverted yield curves that begin to steepen as the central bank eases policy. This was the case in 1990-91, 2001, 2008 and in 2020 (Figures 8-10).
- Early stage economic recovery: these tend to be characterized by easy monetary policy (steep yield curves) and by high but gradually subsiding levels of implied volatility. This was the case in 1992-93, 2002-04 and 2009-12.
- Mid-stage economic expansion: the middle stages of an economic expansion tend to be characterized by steep yield curves and low levels of volatility. These characteristics dominated in 1994-95, 2004-06 and 2013-16.
- Late stage expansions: with volatility having been quelled and unemployment falling, the central banks begins to tighten policy. Late stage expansions are characterized by flattening yield curves and low but rising levels of implied volatility. The US was in late stage expansions at the end of the 1980s, 1997-2000, mid-2006 to 2007 and 2017-19.
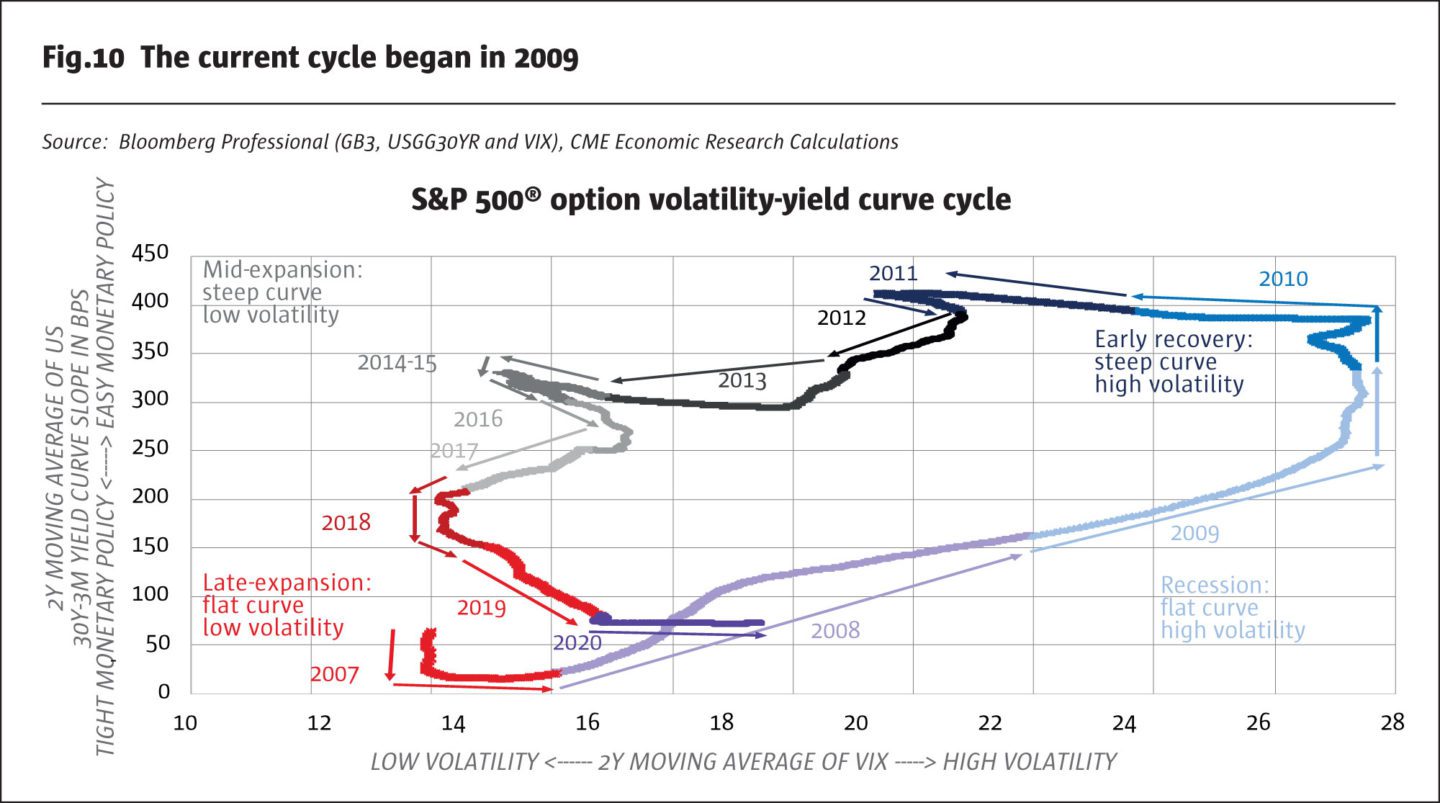
In 2020, the recession was caused by the exogenous shock of the pandemic and not by the consequences of overly tight monetary and other economic imbalances as was the case in the previous economic downturns. Even before the pandemic struck, fixed income markets were clearly concerned. Various segments of the yield curve began to invert as far back as Q4 2018, and the Fed began easing policy in 2019 amid market views that rate hikes had gone too far. In 2019, growth slowed from 3% to 2% and entered a recession in February 2020.
The more pressing question for the markets now is whether the Fed’s monetary policy is accommodative enough to return volatility to levels that are consistent with solid and sustained economic growth? Nearly everyone expects a rebound as lockdowns ease, but is monetary policy accommodative enough to propel growth further? In some ways this sounds like an odd question. The Fed has cut rates to near zero. The Fed is conducting a wide-ranging QE program that goes much further in terms of credit quality than its previous forays into asset purchases which focused mainly on government bonds and mortgages. This time it is delving into municipal and corporate bonds as well.
There are reasons to think that such actions may supress both implied volatility on options as well as realized volatility. Inherent in mortgage, municipal and corporate bonds are short-put options. Essentially, these bonds are akin to a US Treasury + a short-put option on the possibility that the homeowner, local government or corporation defaults on their debt. Hence, when the Fed buys the bonds, it implicitly shorts volatility and writes insurance policies, collecting a premium over Treasuries in the process.
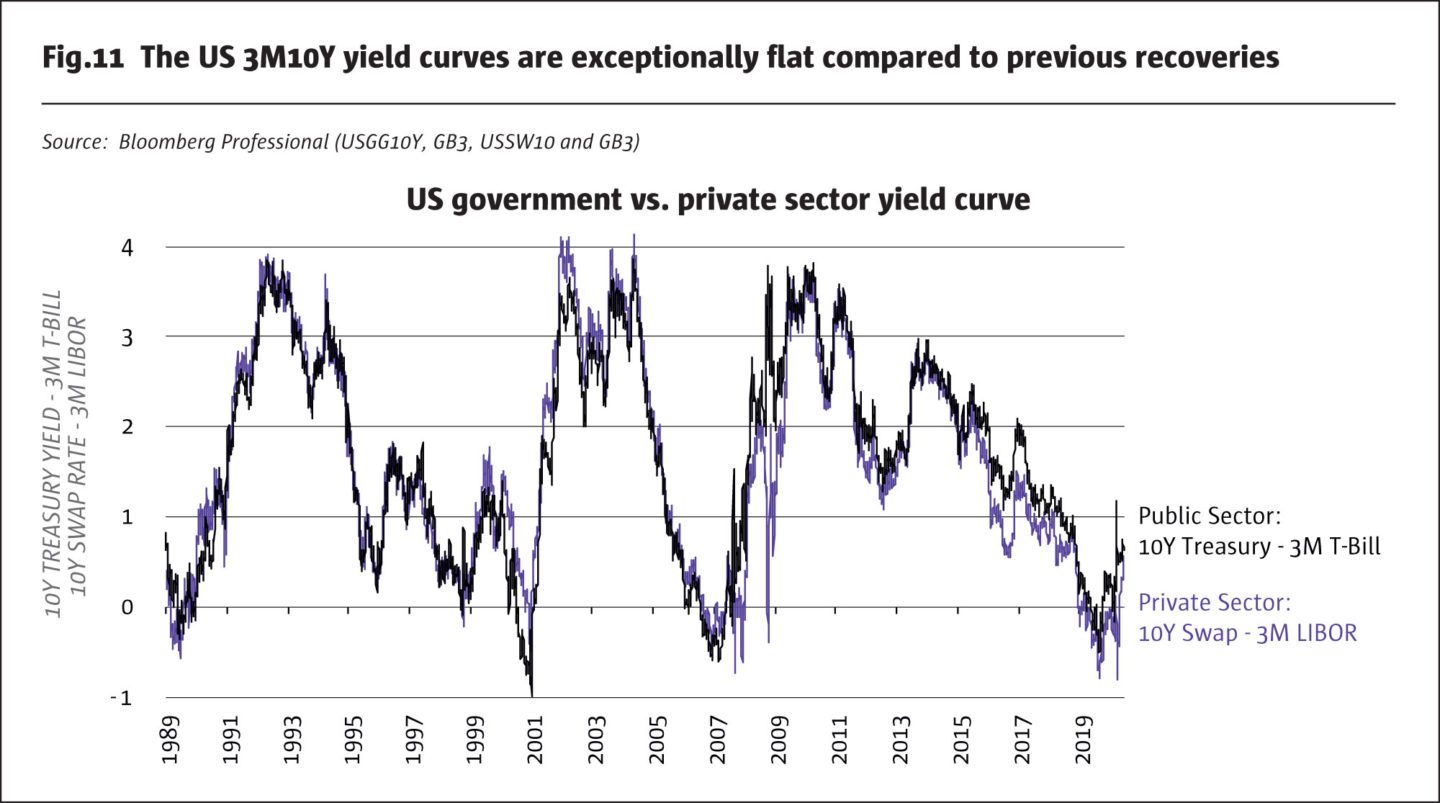
Yet, by other measures, the Fed’s monetary policy doesn’t look so accommodative. First, both private and public sectors yield curves, while no longer inverted, are not particularly steep like they were following past downturns. In 1991-93, 2002-04, and 2009-15, the difference between 3M and 10Y rates was often around 300-400 basis points (bps). Now, its closer to 100 bps in the public sector yield curve and around 30 bps between ICE LIBOR and swaps (Figure 11). This doesn’t look like a yield curve that is optimistic about economic recovery.
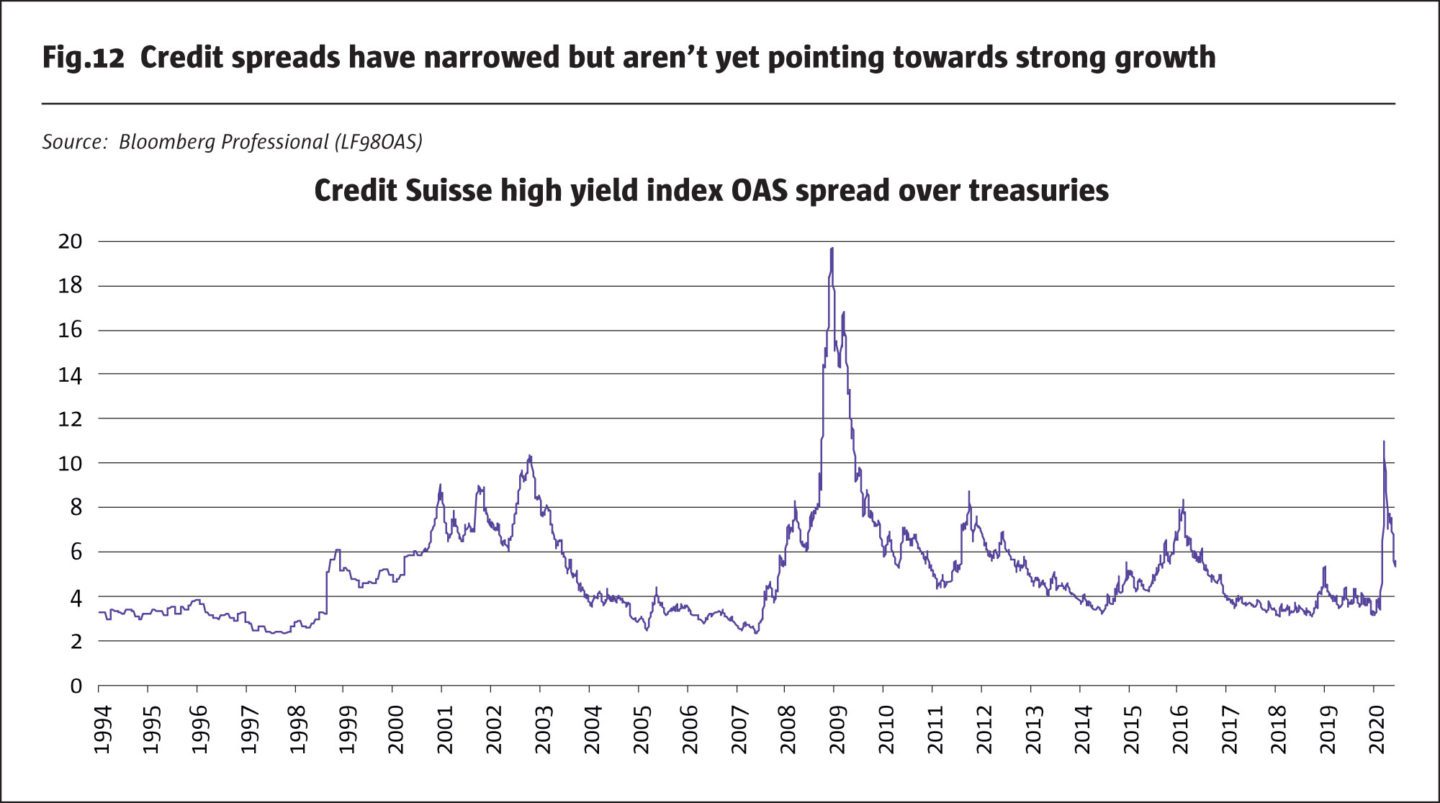
Credit spreads are also sending mixed signals on economic growth. In early March, the spread of high yield bonds over US Treasuries expanded to its widest point since the global financial crisis. Since then, as equity markets have regained much of their lost ground and as the Fed included buying of corporate bonds in its asset purchase programs, their spreads have narrowed but are still not far from levels that prevailed during the recessionary period in 2001 and 2002. On June 3, 2020, the Credit Suisse High Yield Index Options Adjusted Spread reached a level of 5.6% of Treasuries of comparable maturity. Historically, this would be consistent with a weak expansion in the economy, not a strong recovery.
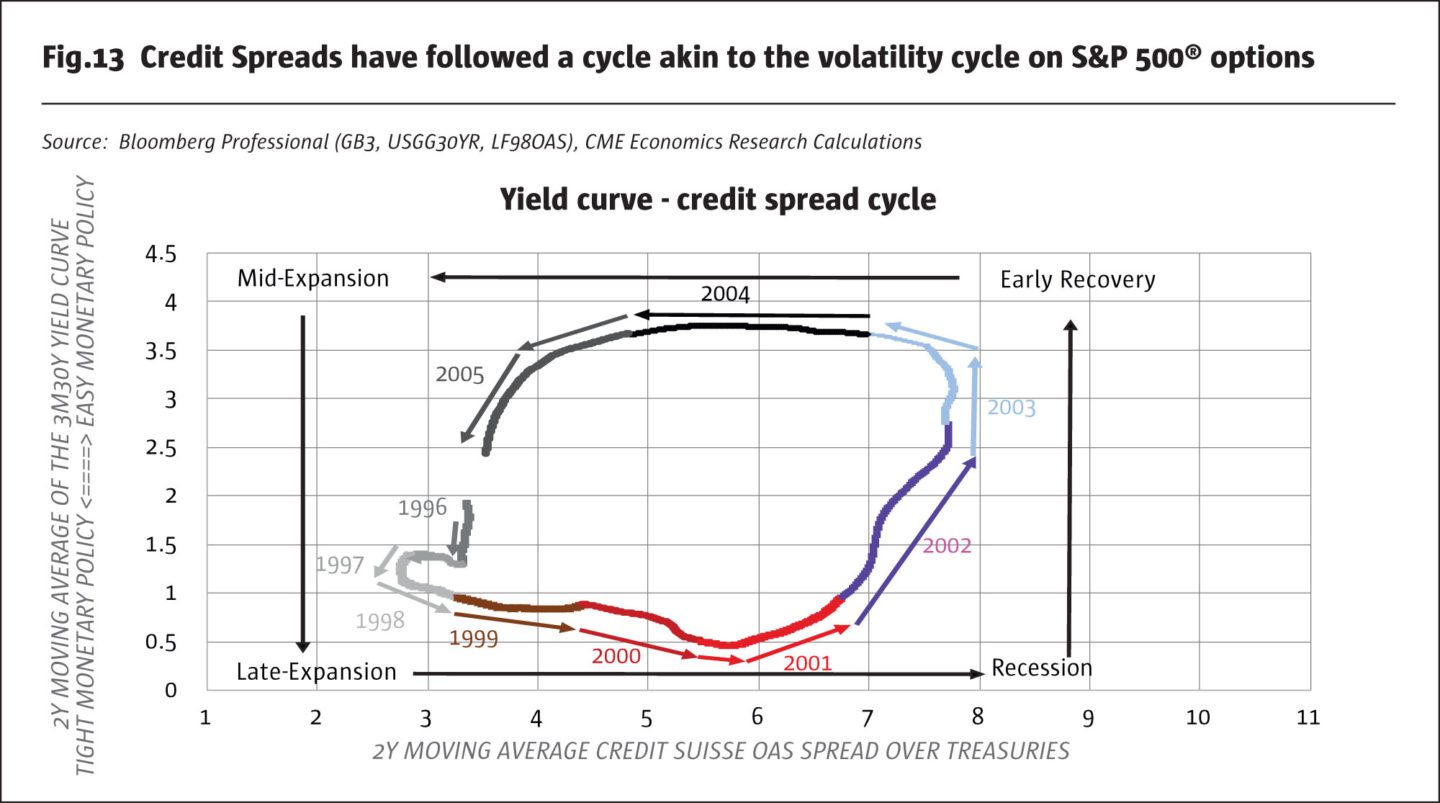
It is important to note that for the past two-and-a-half decades the high yield bond market has been following a cyclical relationship with US monetary policy that is similar to what we observe with equity index options implied volatility (Figures 13 and 14). Recessions tend to be characterized by flat but steepening yield curves and wide credit spreads. Early stage economic recoveries usually feature wide but narrowing credit spreads and steep yield curves. Mid-stage recoveries narrow credit spreads and yield curves that are steep but beginning to flatten in anticipation of Fed rate hikes. Finally, late stage expansions tend to feature flat yield curves and narrow but widening credit spreads.
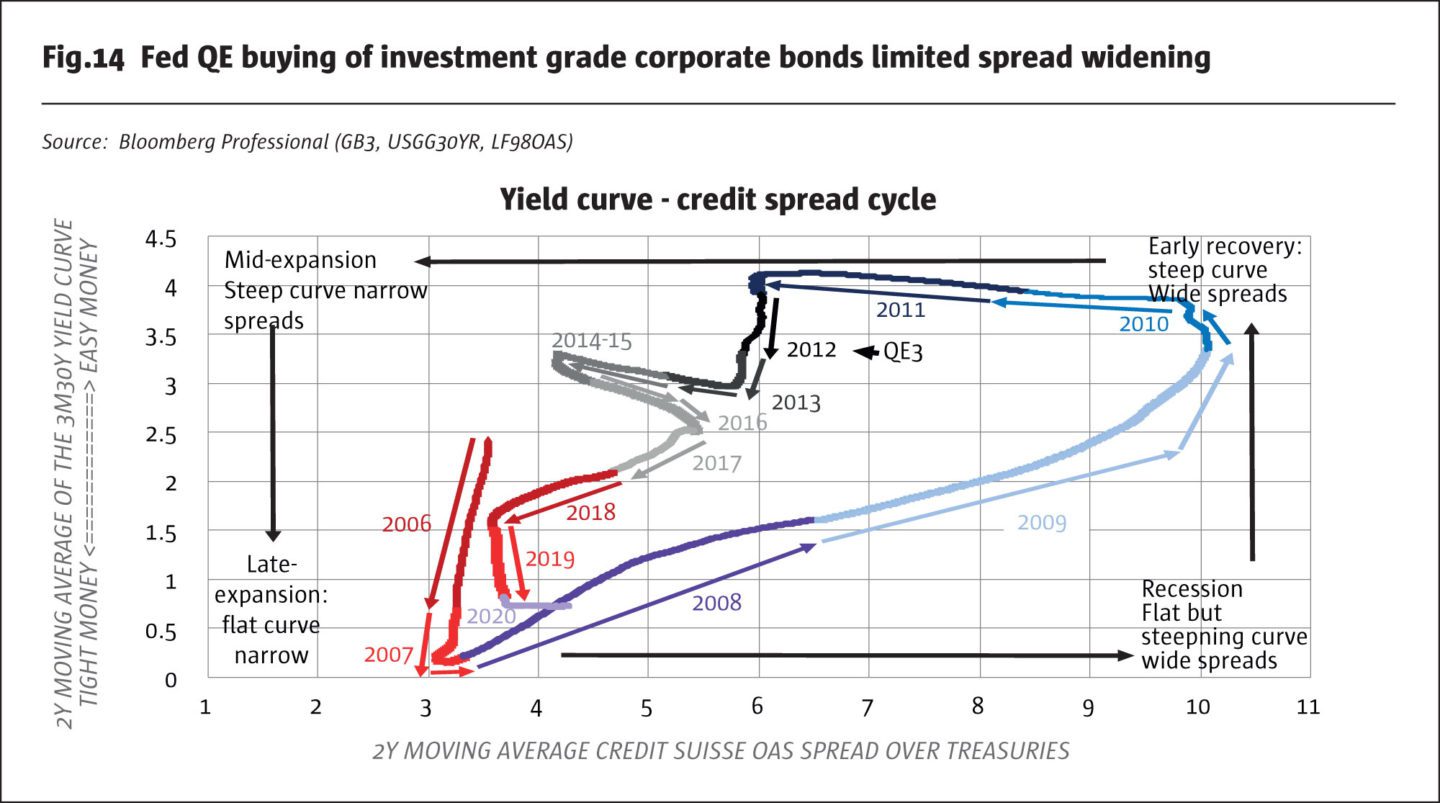
This time around, the Fed does seem to have kept a lid on credit spreads, at least for the moment. But the full history of this particular economic downturn is still being written, and given the fall in commodity prices and the distress in many traditional brick-and-mortar retailers, a re-widening of credits spreads cannot be excluded, especially at the high-yield end of the market where the Fed has not ventured thus far except to buy “fallen angles” – bonds that were investment grade before late March but have subsequently been downgraded.
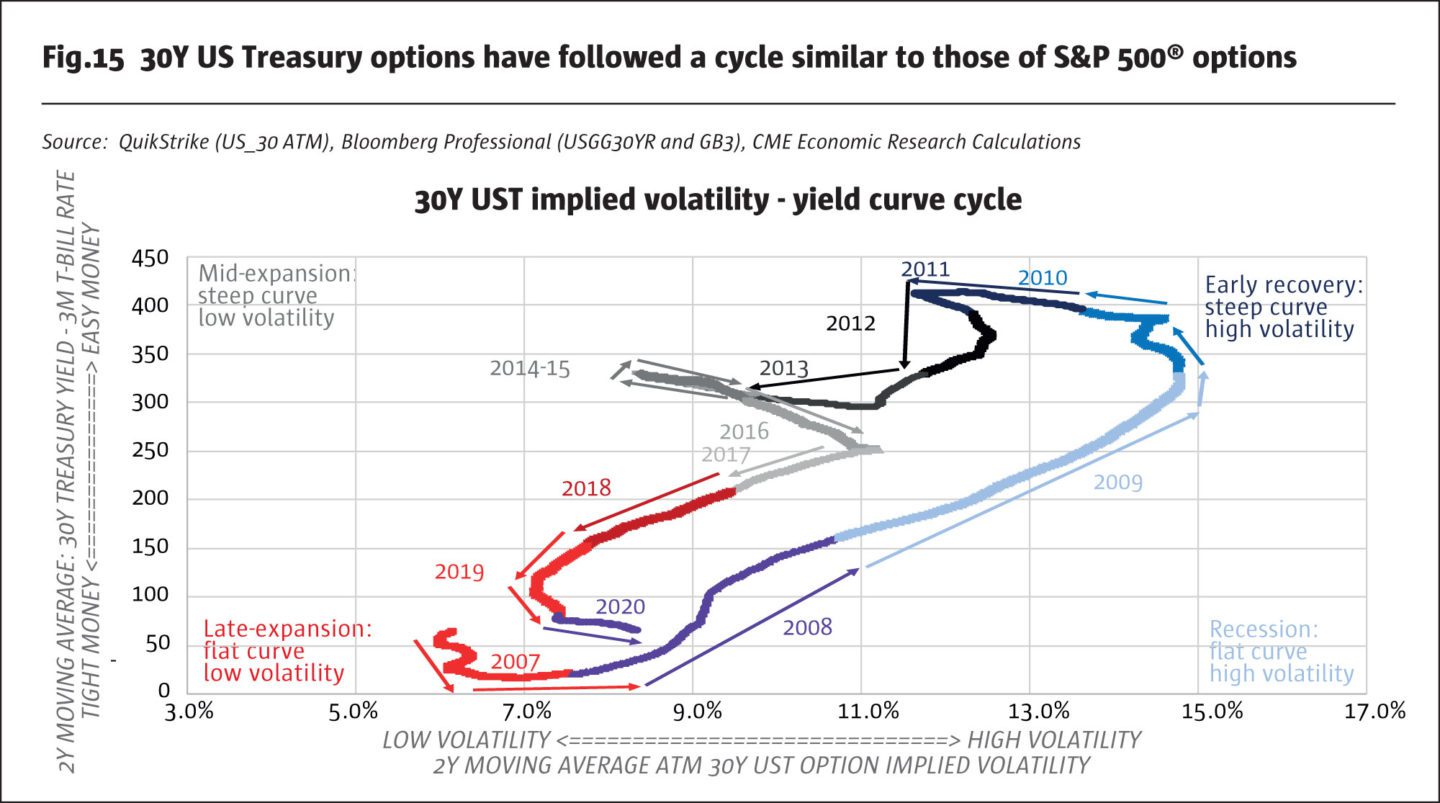
Options on numerous other markets follow a similar cycle. It is evident on options on US Treasuries, especially the 30Y, gold and silver as well (Figures 15-17).
What remains unclear this time is around is how easy the Fed’s monetary policy really is. Will near-zero rates and massive QE be enough to cause volatility to fall? Is having a steep yield curve a necessary pre-condition to subsiding volatility now as it appears to have been in the past? Or will QE buying of various credit products including corporate, mortgage and municipals bonds be sufficient to guide volatility lower on a lasting basis even if the US yield curve never achieves similar steepness to what we saw in 1991, 2002 or 2009 as the past three economic recoveries began? We don’t have answer to these questions and will have to watch how the next few years unfold to see if the Fed’s efforts to support the economy are enough to allow implied volatility to return to levels commonly associated with economic expansions.
Bottom line
- Fed easing appears to have contained volatility in 2Y, 5Y and 10Y bond options.
- 30Y bond options implied volatility remains far above previous levels.
- Implied volatility in equity index futures, precious metals and currencies also remains far above pre-pandemic levels.
- Will Fed easing be enough to lower volatility in the markets on a lasting basis?
- Is a steep yield curve necessary to reduce volatility or will the Fed’s QE prove to be enough?
All examples in this report are hypothetical interpretations of situations and are used for explanation purposes only. The views in this report reflect solely those of the authors and not necessarily those of CME Group or its affiliated institutions. This report and the information herein should not be considered investment advice or the results of actual market experience.
- Explore Categories
- Commentary
- Event
- Manager Writes
- Opinion
- Profile
- Research
- Sponsored Statement
- Technical
Commentary
Issue 149
Where Fed Has and Hasn’t Contained Volatility
Are credit spreads signaling a sluggish economic recovery?
Erik Norland, Senior Economist, CME Group
Originally published in the June | July 2020 issue