During the summer 2014, we conducted a survey to establish The Common Denominators in the CTA and Managed Futures Industry. The survey was sent to over 3,500 financial industry practitioners globally and we received 51 (1.5%) responses. The survey was conducted from 17 June 2014 until 11 July 2014 bythe Nanyang Technological University in Singapore and supported by J8 Capital Management LLP in London.
This article follows on from an earlier article published in The Hedge Fund Journal (Issue 97). The first article presented the most popular markets traded by the CTA industry. This article presents the survey results on the most popular return engines, portfolio management methods and fee structures in the CTA industry, and presents an investible index based on these survey findings. The full survey report has been published in the Journal of Index Investing with the Institutional Investor Journals in the winter 2014 issue.
Introduction
While the choice of markets is one distinguishing factor between CTAs and managed futures programmes, the choice of return engines, risk allocation, money management, and fee structure are the next main distinguishing factors. The “return engine” tells us how managers generate returns from the underlying markets. “Risk allocation” tells us how managers weigh the different underlying markets, and “money management” how they manage risk and allocate. Finally, we discover which fee structures are most common in the CTA and managed futures industry.
Return engines
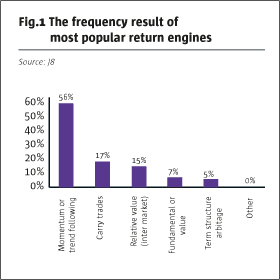
A fund’s return engine is potentially the most important distinguishing feature between itself and other managers. The survey found the most common family of return engines to be “momentum or trend following” which received 56% of survey ticks (see Fig.1).
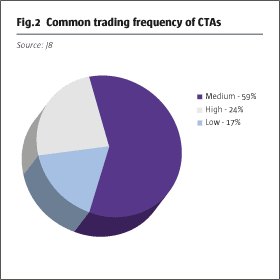
The overwhelming majority opted for “medium” as the most common trading frequency (59%; see Fig.2).
61% of the respondents voted 100% systematic as their management style – hence, making fully systematic systems the most preferred management style. Only 4% preferred purely discretionary as their management style, leaving 35% taking a hybrid approach between systematic and discretionary (see Fig.3).
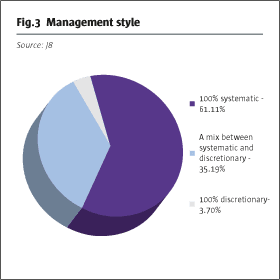
It is interesting to note that the likelihood of a CTA/managed futures programme being 100% systematic and using momentum or trend following and trading at low to medium frequency is about 20%.
Risk and asset allocation
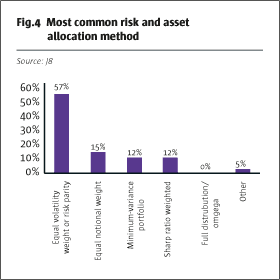
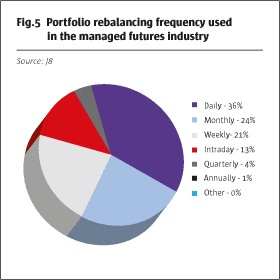
Risk and asset allocation play an important part in portfolio construction. Fig.4 shows risk parity or equal volatility weighted, as popularised by Bridgewater Associates in 1997, as the most common mechanism (57%). Daily portfolio rebalancing was the most popular rebalancing frequency (Fig.5).
Money management
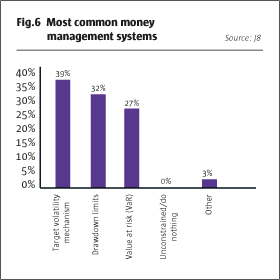
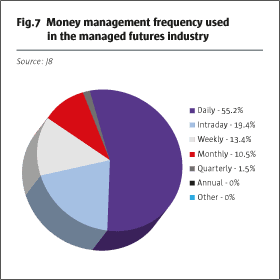
In money management, use of a target volatility mechanism is the most popular method (39%) and setting drawdown limits (32%) or value at risk (27%) follow closely behind (see Fig.6). Two respondents commented they believed stop-loss mechanisms were of importance. Money management is most commonly performed daily (see Fig.7).
Fees structure
Managers typically charge a management fee and a performance fee. The management fee is often perceived as a base fee to ensure the operation does not run out of money, whereas the performance fee is to align the manager’s interest with the investor’s, and both share in the success. Sometimes, hurdle rates need to be reached before the manager enjoys any share in the performance success.
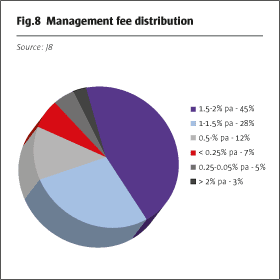
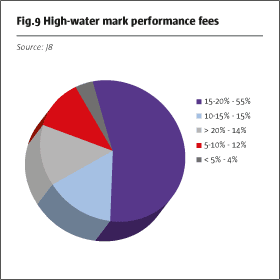
As shown in Fig.8, respondents believe management fees of between 1.5% and 2% per annum to be most widespread, with 45% of all responses. A 15-20% high-water mark was the most popular performance fee structure (55%) (see Fig.9).
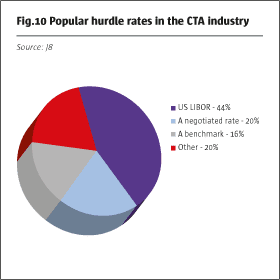
A number of comments also suggested that no hurdle rate was a regular occurrence. However, if they do exist, the choice of hurdle rate is dominated by US LIBOR, with 44% choosing this. A negotiated rate is not uncommon either (see Fig.10).
Conclusion
The headline findings of the survey suggest that the CTA and managed futures industry could be characterised as trading a portfolio of diversified popular global markets in a momentum or trend-following-driven risk-weighted portfolio managed to a target volatility and applying a 2/20 fee structure.
THE CTA COMMON DENOMINATOR INDEX
A new CTA benchmark
We apply these survey findings and create a new investible index. The CTA Common Denominator Index (CTACDI) is derived from these survey results to establish the common denominators in the CTA and managed futures industry. It may serve investors as an investible and fair representation of the CTA and managed futures industry, and allow them to gain exposure to CTA-like returns through a formulaic investment process. We show that the CTACDI mimics popular CTA and managed futures benchmark indices. The objective is not to outperform the industry nor to introduce other enhancements or optimisations but to deliver a fair representation of the industry only.
The CTA Common Denominator Index
To construct an investible benchmark index, we borrowed from established index methodologies such as the S&P Goldman Sachs Commodity Index [2014] and S&P Index Mathematics [2014]. In our full paper on this index construction we demonstrate in detail how we define underlying rolling long or short future indices based on the SPGSCI methodology, and use sensitivity analysis to determine robust parameterisation for momentum look-back period, signal observation frequency, portfolio rebalancing frequency, the look-back period of volatility measures used in risk parity and target volatility calculations, and portfolio weighting mechanism. The paper will be published in the Journal of Index Investing by the Institutional Investor Journals in the spring 2015 issue. In this article, we present the summary building blocks only.
Markets
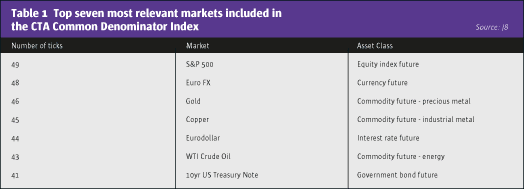
The survey participants were asked to select the most relevant markets for CTAs and managed futures managers to trade in. The top seven ranking markets each represent one of the core asset classes of equity indices, commodities, currencies, government bonds, and interest rates, and within commodities the three most relevant commodity sectors of energy, precious, and industrial metals (see Table 1). We accept these top seven markets as representative constituents of the wider global market spectrum and include these seven markets in the CTACDI. For each market, we calculate the rolling long-only excess return indices on which signals are applied.
Trade signal calculation and implementation
The survey participants chose “momentum or trend following” as the most popular return engine. In creating the momentum return engine for the CTACDI, we chose a 12-month look-back period for a simple price return calculation to derive the trading signals. The trading signal S(t) is calculated daily on the close of the markets. The signal is then implemented on that close and becomes effective for the next day’s return.The signal dictates to enter into a long position if the 12-month momentum is positive, and to take a short position otherwise. The 12-month momentum is calculated by dividing the current underlying index value over the value 12 months before, and subtracting 1 from the quotient. If there is nochange in signal, the previous day’s position is kept unchanged. The index is always invested in the markets, and zero or neutral positions are not possible.
Portfolio construction
The survey confirmed risk parity as the most common “risk or asset allocation” method among CTAs and managed futures programmes. The concept of risk parity stems from Bridgewater’s All Weather allocation principles, first established in 1996. It allocates more capital to less volatile and less capital to more volatile markets. It is inverse volatility-weighted.
In risk parity, we calculate every month the inverse 90-day volatilities of the underlying markets and then weigh each market proportionally.
Money management
The survey found that using a target volatility mechanism is the most common way to manage money in the CTA and managed futures industry. Leverage in the portfolio is decreased in volatile markets and increased in less volatile markets, as measured by realized volatility versus target volatility. Leverage is applied on the portfolio returns.
Leverage is increased or decreased proportionally to the ratio of target over realized volatility. The leverage is also managed monthly only at the same point in time that the risk parity portfolio weights are applied.The target volatility for the CTACDI is arbitrarily set at 5% as it produces a good imitation of other CTA benchmark indices.
Embedded interest, costs and fees
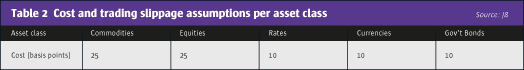
The survey set the band for the most common management fee between 1.5% and 2% per annum, and for the high-water mark performance fee between 15% and 20%. For the CTACDI, we calculate the embedded fees daily accruing with management fee of 2% per annum and a high-water mark performance fee of 20%. The index calculation includes interest earned on cash. It is calculated as the daily returns on 90-day US Treasury bills and the AUM. We use the same formula and methodology as provided by S&P GSCI [2014] for the Total Return Index calculation. The T-Bill returns were added to the excess returns. Then we subtracted trading costs, management fees and performance fees from the total returns. In Table 2, we assumed following trading costs and slippage per annum and markets before leverage.
Comparison to other benchmark indices
In determining if the resultant index is a “good and fair” representation of the CTA and futures industry, we compare the time series against three popular but not investible benchmark indices: the Barclay CTA Index, the Newedge CTA Index, and the Credit Suisse Managed Futures Index.We find that, with 95% confidence, the CTACDI correlates with popular CTA and managed futures indices between a lower bound of 0.47 and upper bound 0.69 (Table 3).
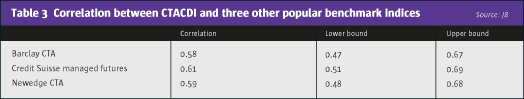
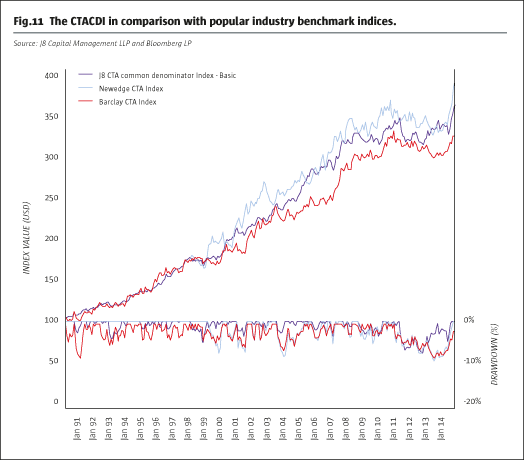
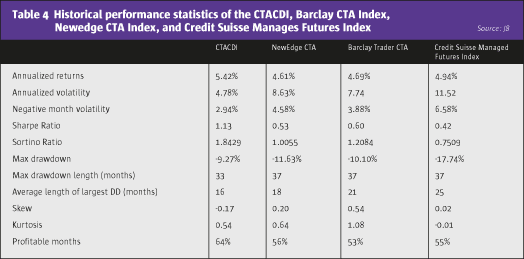
Table 4 and Fig. 11 show the CTACDI time series to mimic popular CTA and managed futures indices. The CTACDI index exhibits significantly higher risk-adjusted returns than its non-investible peers, and shows lower and shorter drawdown periods.
Conclusions
We set out with a survey to establish the common denominators in the CTA and managed futures industry and we discovered a simple investible method to mimic the industry. The CTA Common Denominator Index is derived from the core principles practitioners use in the industry. This minimalistic but “democratic” index trades seven core futures markets of the S&P 500, euro, gold, copper, WTI crude oil, Eurodollar, and 10-year US portfolio construction and target volatility for money management. Cash is compounded at the risk-free rate of 90-day US T-Bills and it embeds assumed trading costs and slippage, and also applies a common 2/20 fee structure. The findings lead us to conclude that the CTA and managed futures industry by far and large may be described as a low to medium-frequency momentum or trend-following industry, trading global liquid markets only in a risk-weighted portfolio, managed to a target volatility. Coincidentally, we found that the CTACDI also seems to mimic the movements of those popular but non-investible CTA and managed futures benchmark indices. Therefore, the CTACDI may not only serve as a new benchmark index for the industry but also be used in investment products to gain exposure to CTA-like returns.
Hui Yu Chen and Robert L.K. Tiong: Nanyang Technological University, Singapore. Tillmann Sachs: J8 Capital Management LLP, London. The authors thank Bolaji Olaniru, Vitali Sakovic, Matthew Jones and Tan Chong It for their contribution and J8 Capital Management LLP for their support.
References
Baltas, A.-N., Kosowski, R. “Momentum Strategies in Futures Markets and Trend-following Funds.” Imperial College Business School, 2012
Bridgewater. “The All Weather Story” http://www.bwater.com/Uploads/FileManager/research/All-Weather/All-Weather-Story.pdf
Chen, Hui Yi. Sachs, Tillmann. Tiong, L.K. Robert. “Common denominators in the Community Trading Advisor and managed futures industry – a survey report.” Journal of Index Investing, Institutional Investor Journals, Winter 2014, pp. 46-58.
Faith, Curtis M. The Way of the Turtle. McGrawn-Hill, 2007.
Gorton, Gary B. Hayashi, Fumio. Rouwenhorst, K. Geert. “The Fundamentals of Commodity Futures Returns.” 2012.
Gorton, Gary B. Rouwenhorst, K. Geert. “Facts and Fantasies about Commodity Futures.” Yale ICF Working Paper No. 04-20, 2005.
Moskowitz, Tobias. Ooi, Yao Hua., Lasse H. Pedersen. “Time Series Momentum.” [2010] Narang, Rishi K. Inside the black box. John Wiley & Sons, Inc., 2013.
Du Plessis, Johan. Demystifying Momentum: Time-series and cross-sectional momentum, volatility and dispersion. Master’s thesis. University of Amsterdam, Amsterdam, 2013 S&P Dow Jones Indices.
S&P GSCIR Methodology. McGraw Hill Financial. May 2014.
S&P Dow Jones Indices. Index Mathematics, Methodology. McGraw Hill Financial. March 2014
- Explore Categories
- Commentary
- Event
- Manager Writes
- Opinion
- Profile
- Research
- Sponsored Statement
- Technical