Gold prices have been on a wild ride. Between 2000 and 2011, they rose from $280 to around $1,900 per ounce before falling back to $1,050 in 2015. Currently, they are trading close to $1,300 an ounce. Gold has made similar-sized moves when priced in the Chinese renminbi (CNH). From a CNH perspective, prices rose from 2,000 to 12,000 between 2001 and 2011 before falling back to 7,000 in 2015. Currently, it’s trading near 9,000 CNH (Fig.1).
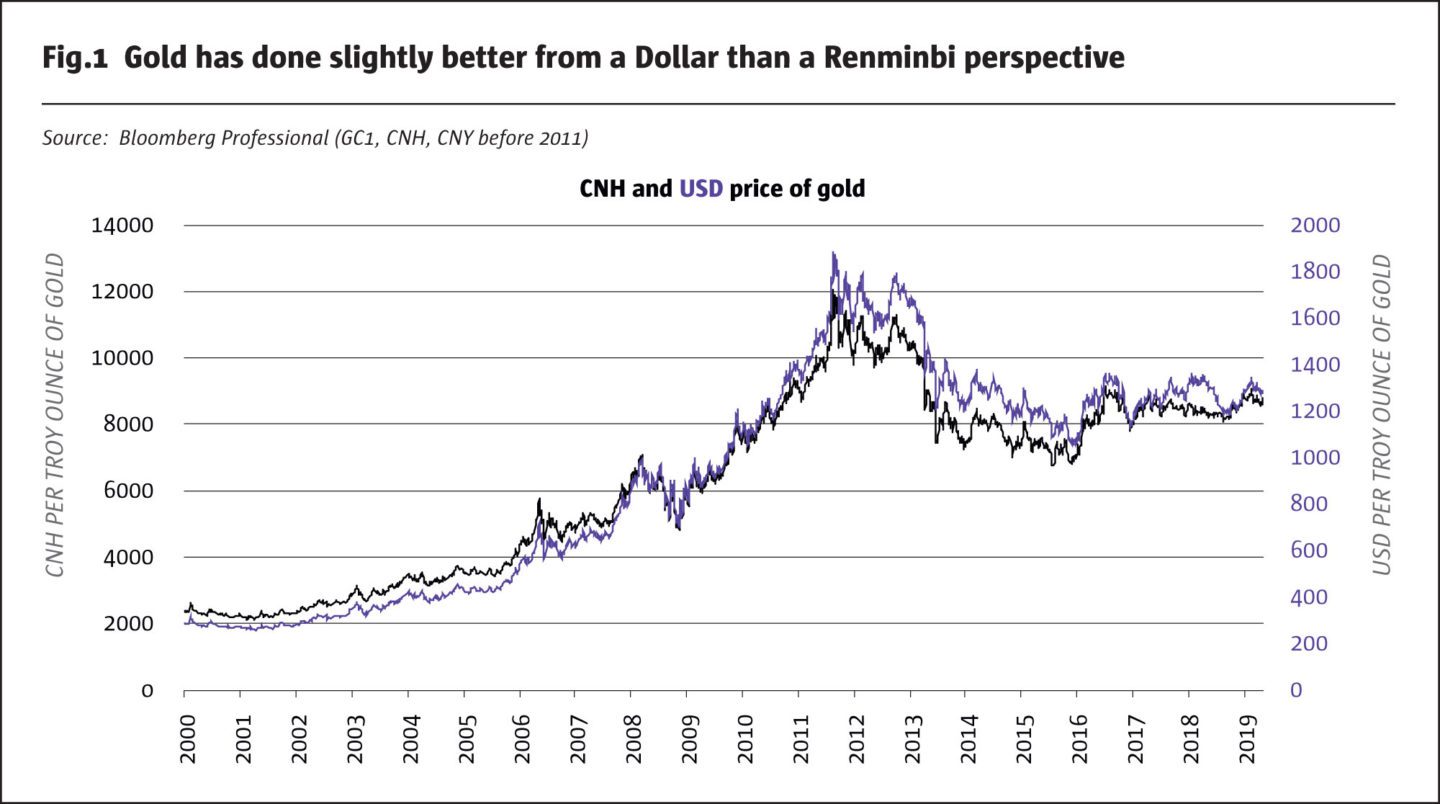
The similarity in performance reflects the stability of CNH versus USD, staying within about a 25% range during the past two decades.
During this time, there were four main drivers of gold’s returns:
- US dollar: the weaker the greenback, the better the performance of gold prices, generally.
- US interest rates: the easier the US monetary policy, the better for gold, generally.
- Mining supply: growth in mining supply is typically negative for gold prices.
- Chinese growth: stronger growth in China is usually great news for most commodities but gold is one of the few exceptions.
Is gold a hedge for Chinese growth?
Let’s begin with China and its influence on gold. From a Chinese perspective, gold has been a great investment since 2000 but it has not performed as well in CNH terms compared with most other currencies owing to the 37% increase in value of the renminbi versus the US dollar between 2005 and 2013. Since 2013, however, CNH has weakened by about 10% versus USD, delivering a little extra boost to Chinese gold investors.
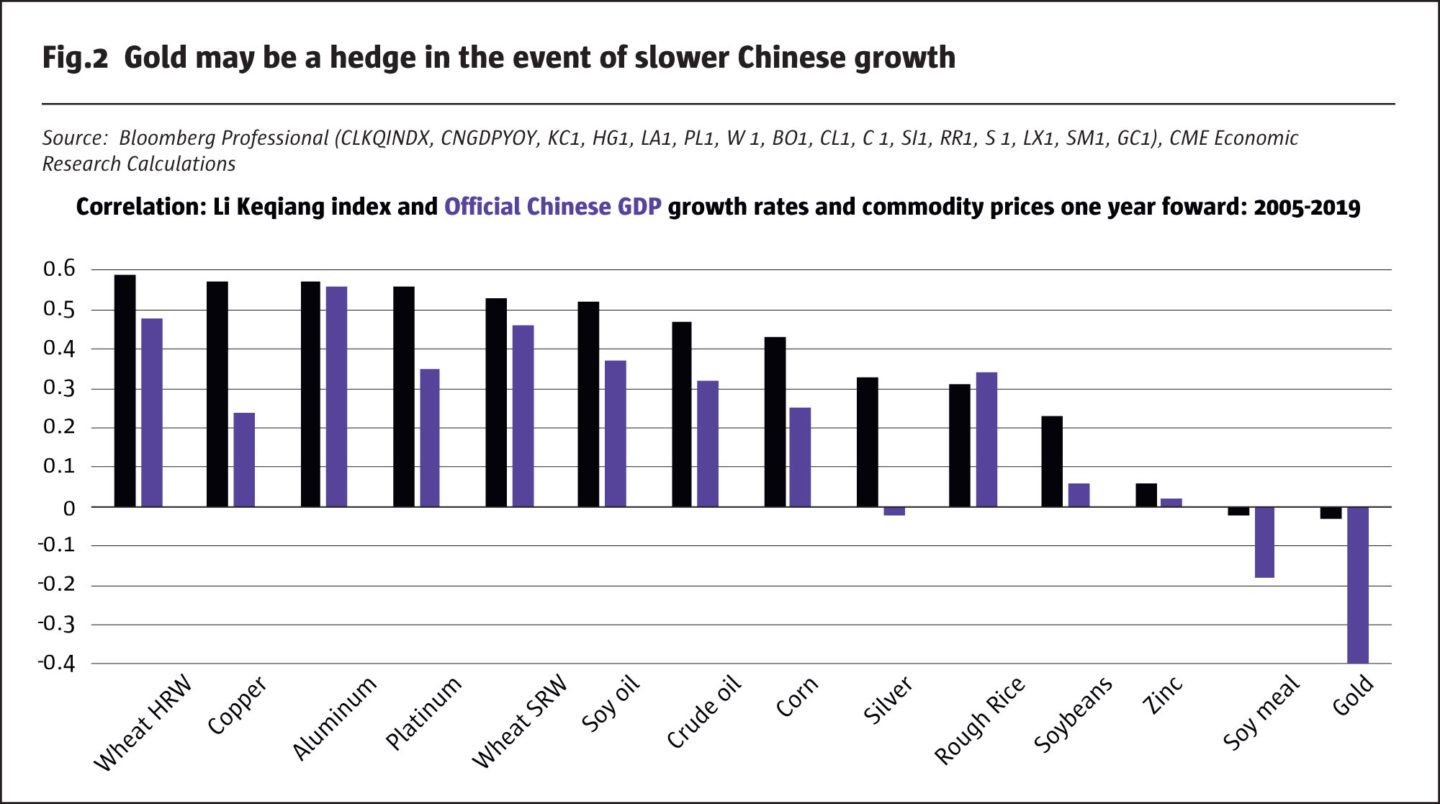
China’s economic growth sent the prices of most commodities soaring from 2001 until 2011. Since 2011, slower Chinese growth has been bad news for most commodity prices. Curiously, however, while gold broadly followed commodities higher from 2001 to 2011 and lower since 2011, it shows the opposite correlation to changes in Chinese growth. Many commodities, including wheat, copper, aluminum, platinum, soybean oil and crude oil have had strong positive correlations with both the “Li Keqiang” index (a narrow but useful measure of Chinese growth that focuses on electricity consumption, bank loans and rail freight volumes) and official Chinese GDP. Gold is one of the few commodities to exhibit a negative correlation with both measures of Chinese output growth since 2005 (Fig.2).
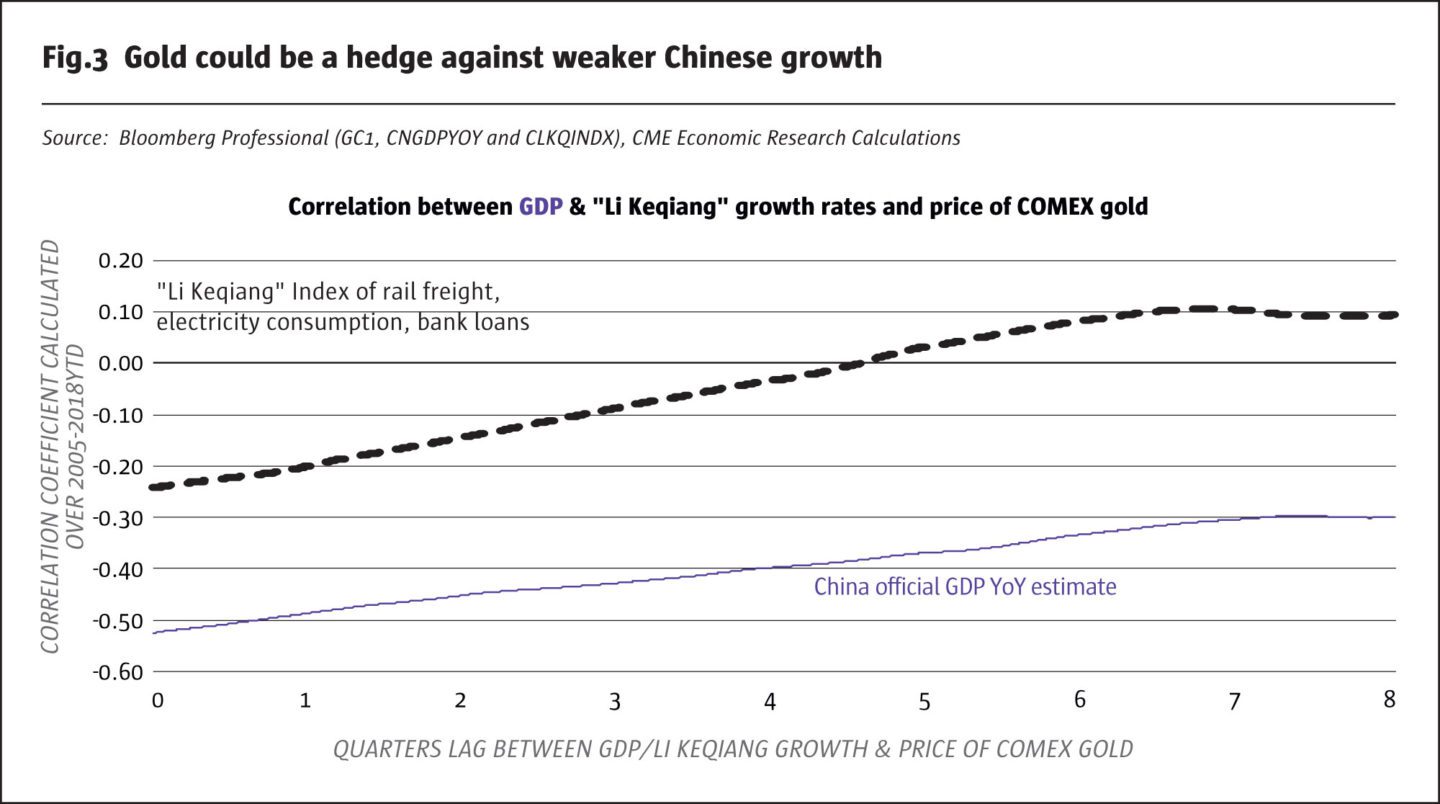
Generally, stronger Chinese growth has been bad for gold and vice versa (Fig.3).
Gold versus the Dollar and Renminbi
From 2010 until mid-2017, gold’s relationship with CNH and USD was simple. Stronger US and Chinese currencies were unambiguously bad for gold. In fact, the strength of USD and the trade weighted CNH explains much of gold’s bear market since the peak in 2011. Since 2017, however, something interesting has happened. Gold has become increasingly negatively correlated with the dollar but has become positively correlated with trade-weighted CNH (Fig.4).
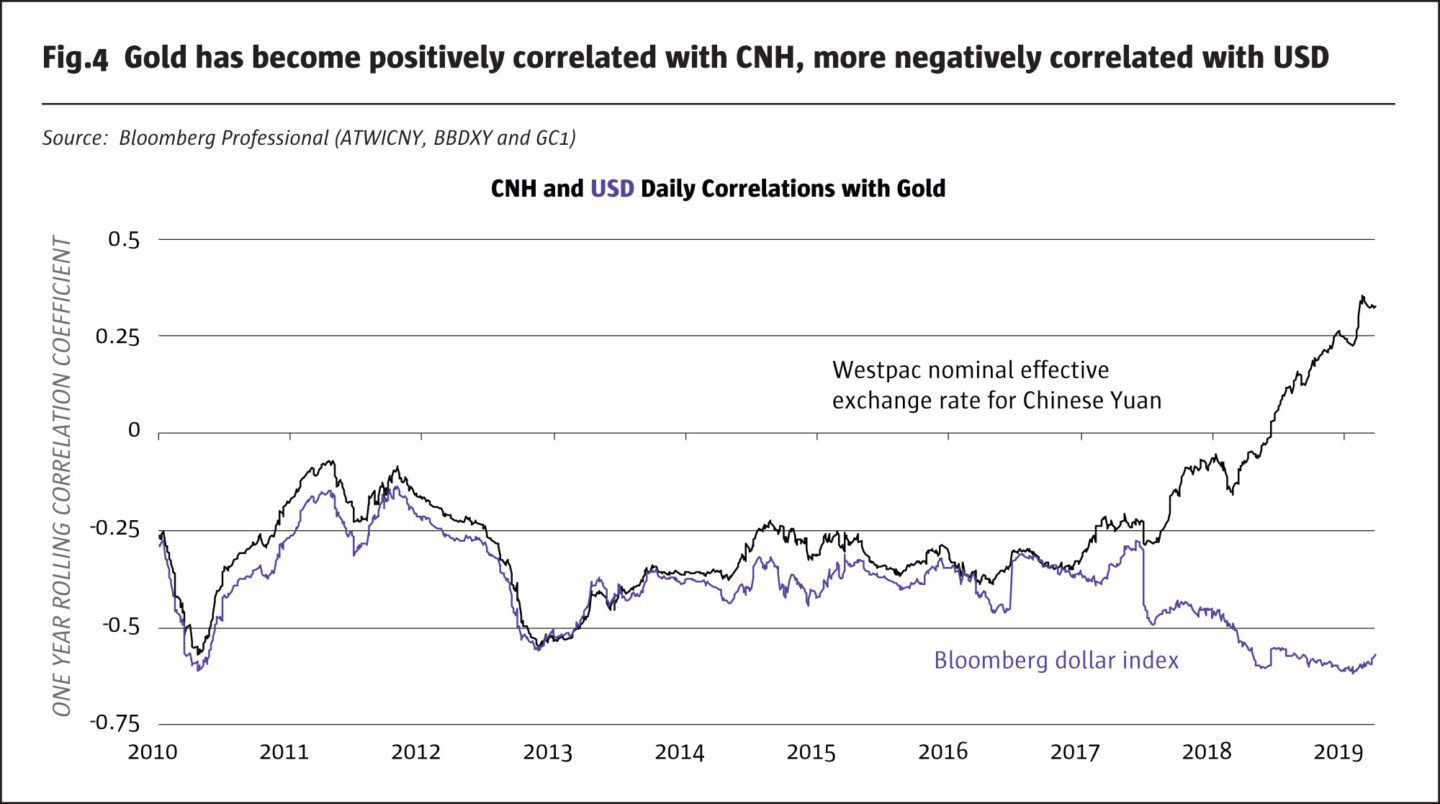
In short, the weakening of CNH, particularly in Q2 and Q3 2018, during the early stages of the US-Chinese trade war, appears to have reduced gold demand. Since Q4, CNH’s strength may have contributed to the bid in gold prices. As such, any positive resolution to the trade dispute might be bullish for CNH and gold. More broadly, however, divergences between the USD and CNH could have a big impact on gold prices, and very differing ones from a renminbi or dollar perspective.
In addition to the trade war changing the correlation between CNH and gold, investors should also pay close attention to the fiscal position of both the US and China. Both nations have high levels of debt with total public and private sector liabilities adding up to around 250% of GDP. China has recently cut taxes and is easing monetary policy. This could encourage the creation of even more debt – which is bullish for growth in the short term but possibly detrimental in the long term. Meanwhile, US budget deficits have exploded over the past two years from 2.2% to 4.5% of GDP. Typically, higher deficits are bad news for the dollar as measured by the Bloomberg Dollar Index, and a weaker USD could potentially be quite bullish for gold (Fig.5).
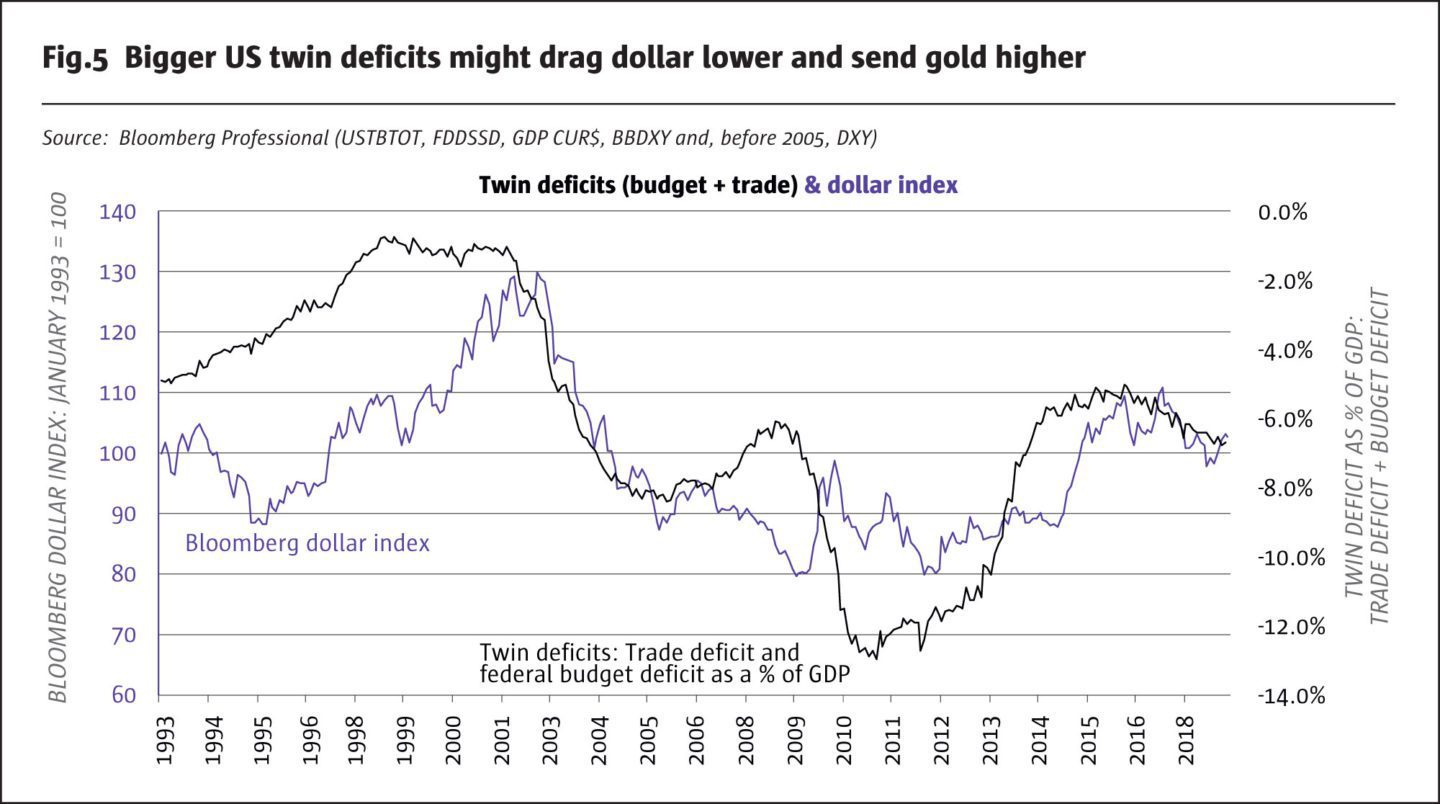
Given the widening deficits, it’s a wonder that the US dollar hasn’t begun to weaken. In 2017 and 2018, the same forces that expanded the US budget deficit, tax cuts and spending increase boosted growth to nearly 3%. This created a growth gap between the US and the rest of the world that temporarily supported the dollar and was, by all appearances, not helpful to gold prices, which remained capped around $1,350. However, the boost to growth from a looser US fiscal stance is probably over.
Monetary policy
An easing of US fiscal policy and the subsequent boost to growth emboldened the Federal Reserve to tighten policy more than it might have otherwise. Eight rate hikes since the 2016 election created significant headwinds for gold. Day-to-day changes in gold prices are usually negatively correlated with the day-to-day changes in forward looking expectations for Fed rate hikes (Fig.6).
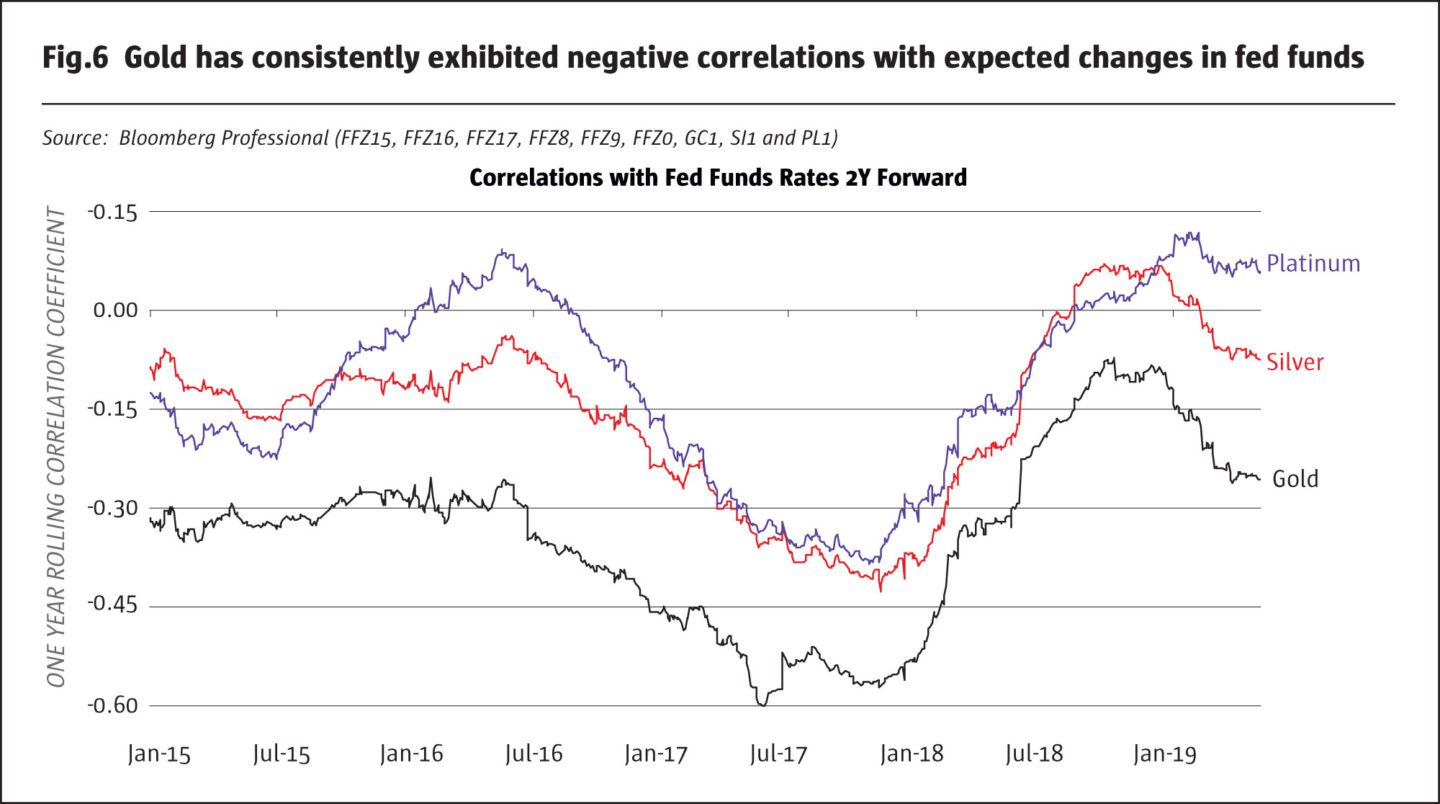
The equity selloff in Q4 2018 and its aftermath have been bullish for gold. The de-pricing of further Fed rate hikes is great news for gold, a store of value which pays no interest. Furthermore, Fed fund futures have recently begun to price a significant easing of Fed policy in the next year or two (Fig.7).
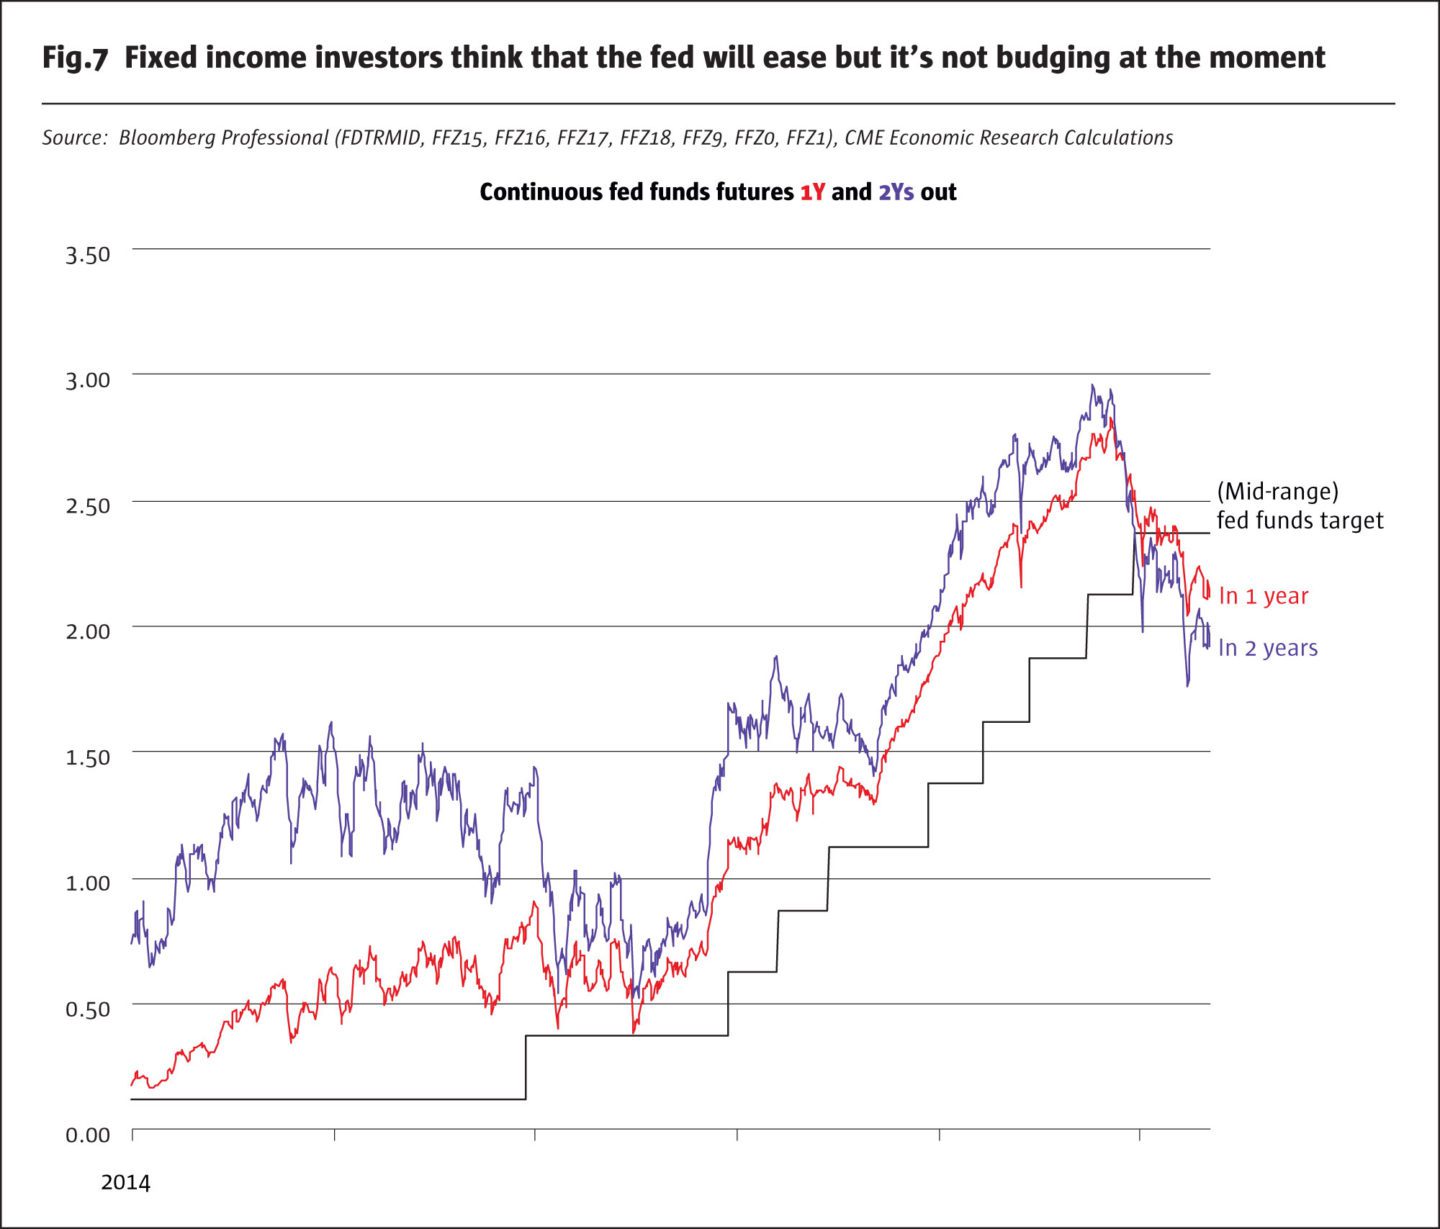
If the Fed follows through with actual rate cuts, this could be quite bullish for gold. Gold investors might not benefit, however, if the Fed stands firm and refuses to cut rates. Meanwhile, the Peoples Bank of China is taking very different approach. Unlike the Fed, it hasn’t tightened policy in years. Instead it is actively easing monetary policy but not through rate cuts. Rather, it is reducing its reserve requirement ratio to encourage more credit creation while keeping interest rates unchanged at low levels (Fig.8).
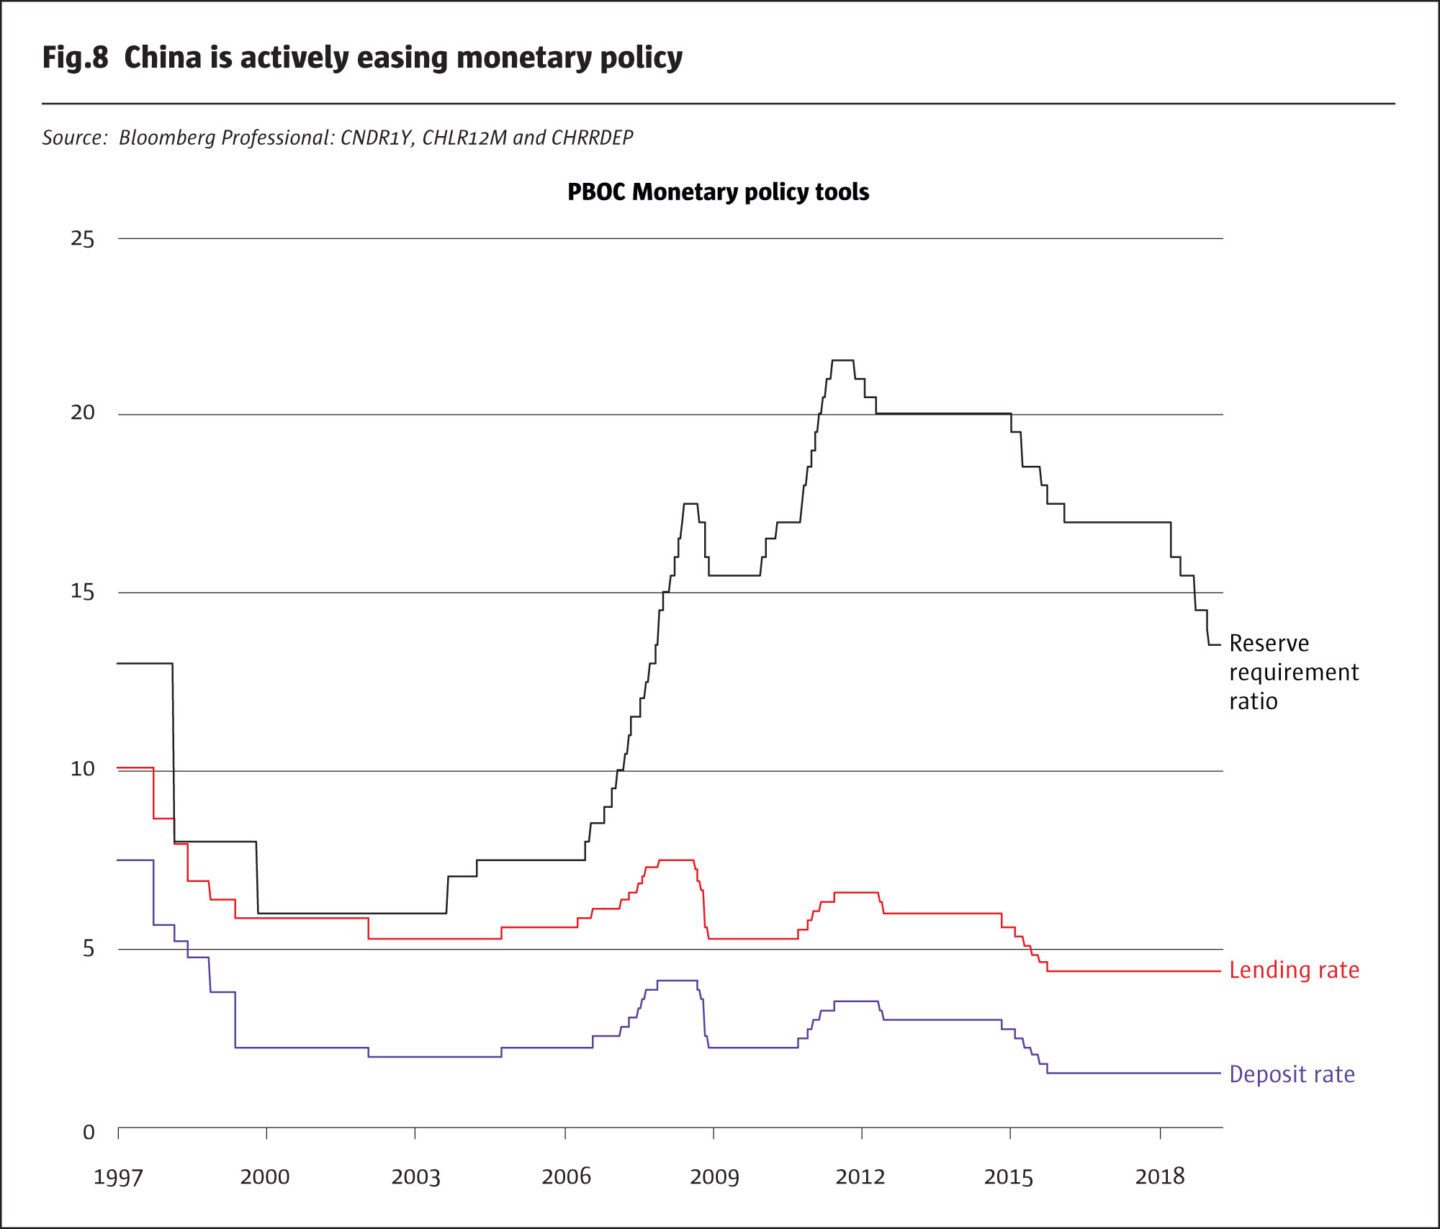
The divergence in CNY and USD’s correlation with gold probably has a great deal to do with the recent divergence in Chinese and US monetary policy. China’s monetary easing appears to be a response to the negative impact of the trade war.
For the moment, big moves in the CNHUSD exchange rate appear to be unlikely but as we get into the 2020s the potential for exchange rate volatility will increase. China faces significant demographic headwinds (negative growth in working-age population between now and 2030 + a slowing of the rural-to-urban transition) and extremely high levels of debt – increasing the temptation of a devaluation of CNH. If the US falls into a recession, the Fed could find itself back at zero rates and budget deficits could explode, dragging the US dollar lower. If there are big moves in CNHUSD, it could create very different returns on gold investments depending one’s currency perspective.
Bottom line
- Gold has earned broadly similar returns for Chinese and US investors since 2000.
- The divergence in returns could grow as US and Chinese monetary policy part ways.
- Growing Chinese debt and a rising US budget deficit could be globally bullish for gold.
- Fed rate cuts, if they happen, might also be bullish for gold.
- If the Fed stands firm and does not cut rates, gold prices might suffer.
All examples in this report are hypothetical interpretations of situations and are used for explanation purposes only. The views in this report reflect solely those of the authors and not necessarily those of CME Group or its affiliated institutions. This report and the information herein should not be considered investment advice or the results of actual market experience.
- Explore Categories
- Commentary
- Event
- Manager Writes
- Opinion
- Profile
- Research
- Sponsored Statement
- Technical
Commentary
Issue 141
Gold
Impact from US and Chinese policies
Erik Norland, Senior Economist, CME Group
Originally published in the June | July 2019 issue