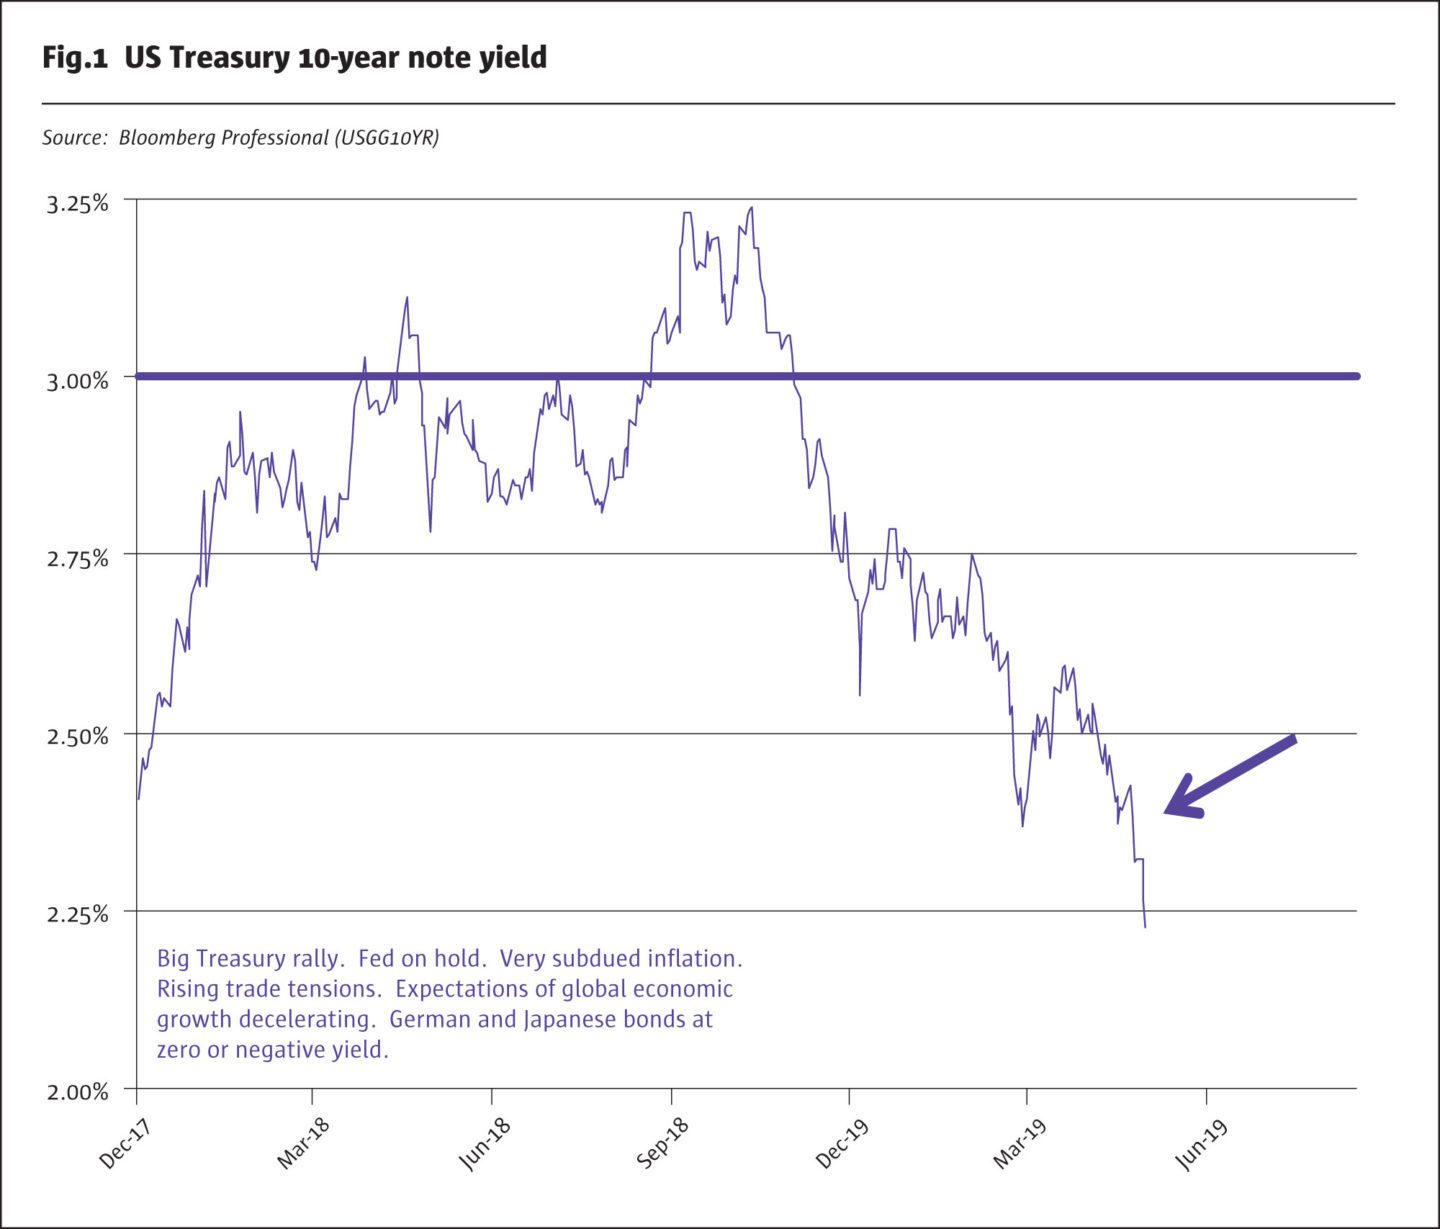
The US has had an extended and very impressive rally in the prices of US Treasury securities. The 10-year US Treasury has seen its yield move from a recent high of 3.23% in early October 2018, down to 2.22% at the end of May 2019. One of the most important questions is whether the Treasury rally is signalling that a US recession is imminent. While we see US real GDP decelerating into the second half of 2019, we do not yet see the US moving into an actual recession in the near future. If that read is correct, then what is driving the US bond market rally? Well, there are a variety of interpretations as to why this move occurred.
Let’s examine a multiplicity of forces impacting the market. (1) Subdued path of inflation. (2) Influence of Germany and Japan government bond yields. (3) Lose-Lose trade war yet lack of panic in US equities. (4) The unusually twisted shape of the US yield curve.
Subdued path of inflation
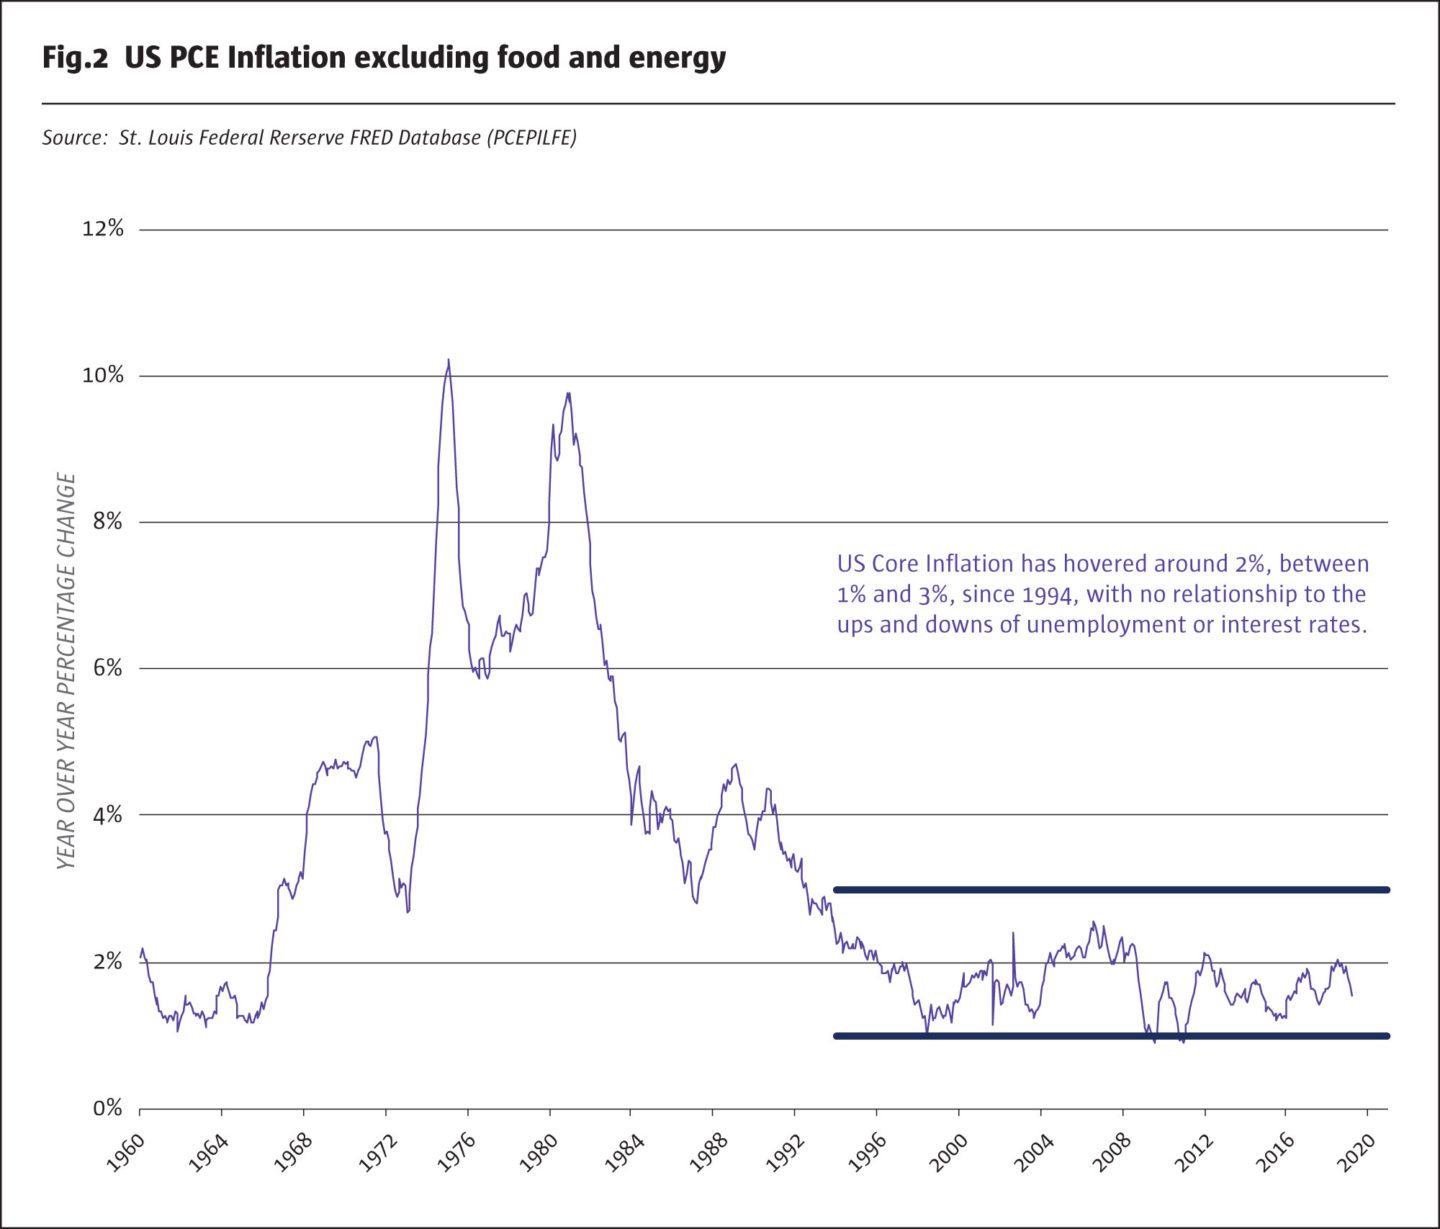
US inflation is subdued. Persistently subdued inflation works to lower inflation expectations as well as increasing the confidence that inflation risk will remain low for an extended period of time. What this means is that the spread between the US 10-Year Treasury yield and the historical core (excluding food and energy) inflation rate tends to narrow as more and more market participants accept the narrative that inflation will remain subdued for a long time.
There are a several reasons that inflation has been subdued since the mid-1990s. First, prudential regulation has increasingly focused on mitigating systematic financial risk through tight capital requirements for financial enterprises. The result has been that central bank monetary policy, from zero rates to quantitative easing, does not lead to increased consumer and business lending, and so economic growth is not stimulated, inflation is not encouraged – only asset prices rise and volatility is dampened. Secondly, financial firms are much more proficient in their interest rate risk management than they were in the 1970s or 1980s before interest rate futures were widely used. Improved interest rate risk management in the 1990s and 2000s has meant that for a given small change in short-term interest rates, there is virtually no meaningful impact on financial firms’ earnings, and behaviour is not changed. Third, the internet age has brought amazing transparency to prices. Consumers can comparison shop on their smart phones, and this has shifted pricing power away from businesses and constrained inflation pressures. Fourth, while the era of globalisation may now be going in reverse with the escalating US-China trade war, there is little question that trade growth and globalisation has served to keep a lid on consumer prices for decades. The bottom line, though, is that for every month inflation remains subdued, it provides fuel for lower government bond yields.
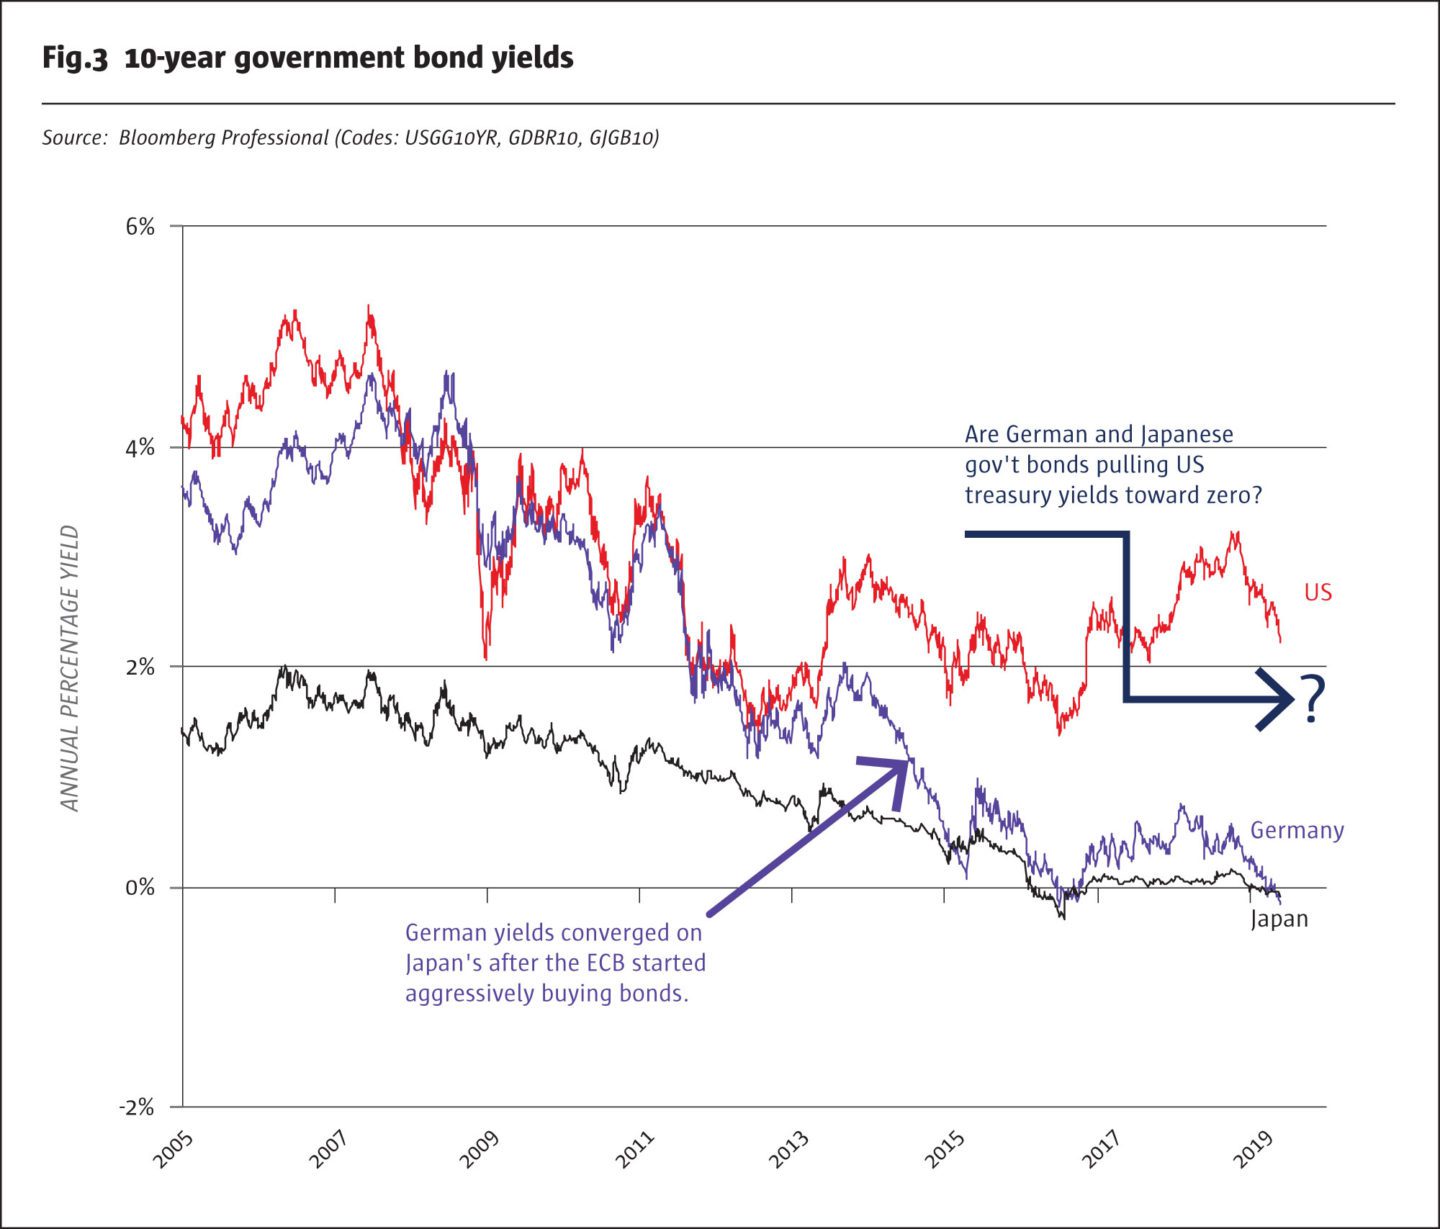
The Bank of Japan is the king of quantitative easing. Expanding its purchases of Japanese Government Bonds (JGBs) dramatically since 2013, it has anchored JGB yields near zero. The European Central Bank (ECB), initially in the aftermath of the Great Recession of 2008-2009, chose to make emergency liquidity loans to the financial sector rather than purchase assets. This policy changed in 2015, as the ECB embraced quantitative easing, which helped drive German Bund yields to converge with JGBs.
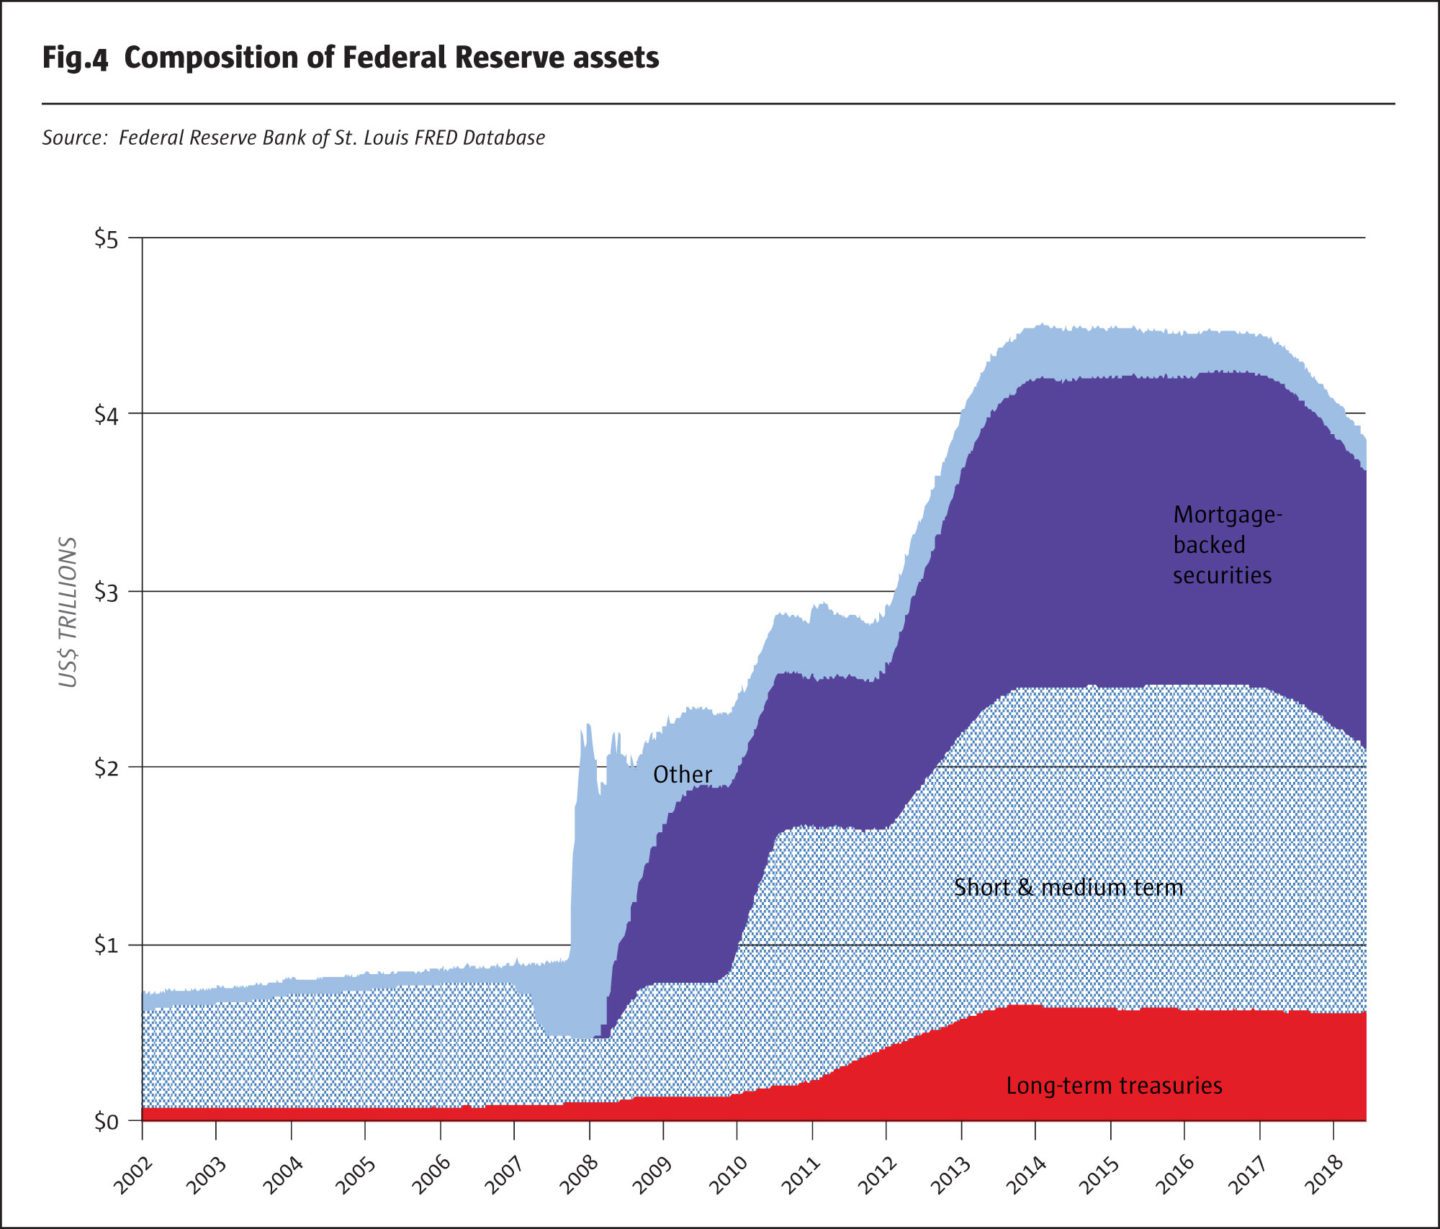
By contrast, the US Federal Reserve (Fed) was early to quantitative easing and massive asset purchases, but in 2018 the Fed switched gears and started to reduce the size of its balance sheet – quantitative tightening (QT). We expect the Fed to end its balance sheet shrinkage in 2H/2019. Moreover, even as the Fed’s balance sheet has shrunk, the Fed has been very careful not to shrink its holdings of longer-term US Treasury securities, even as it allowed its short-term Treasuries and mortgage-backed security holdings to shrink. Thus, the shift to QT had virtually no impact on the long-term Treasury market.
Still, the reality for global fixed income market participants is that US 10-Year Treasuries offer 2.2% more yield than similar maturity German and Japanese bonds, and the exchange rate risk has been relatively modest among the US dollar, euro, and Japanese yen. Even with a little FX risk, there is a natural and powerful competitive pull from German and Japanese bond markets toward lower US Treasury yields.
Escalating trade war and US equities
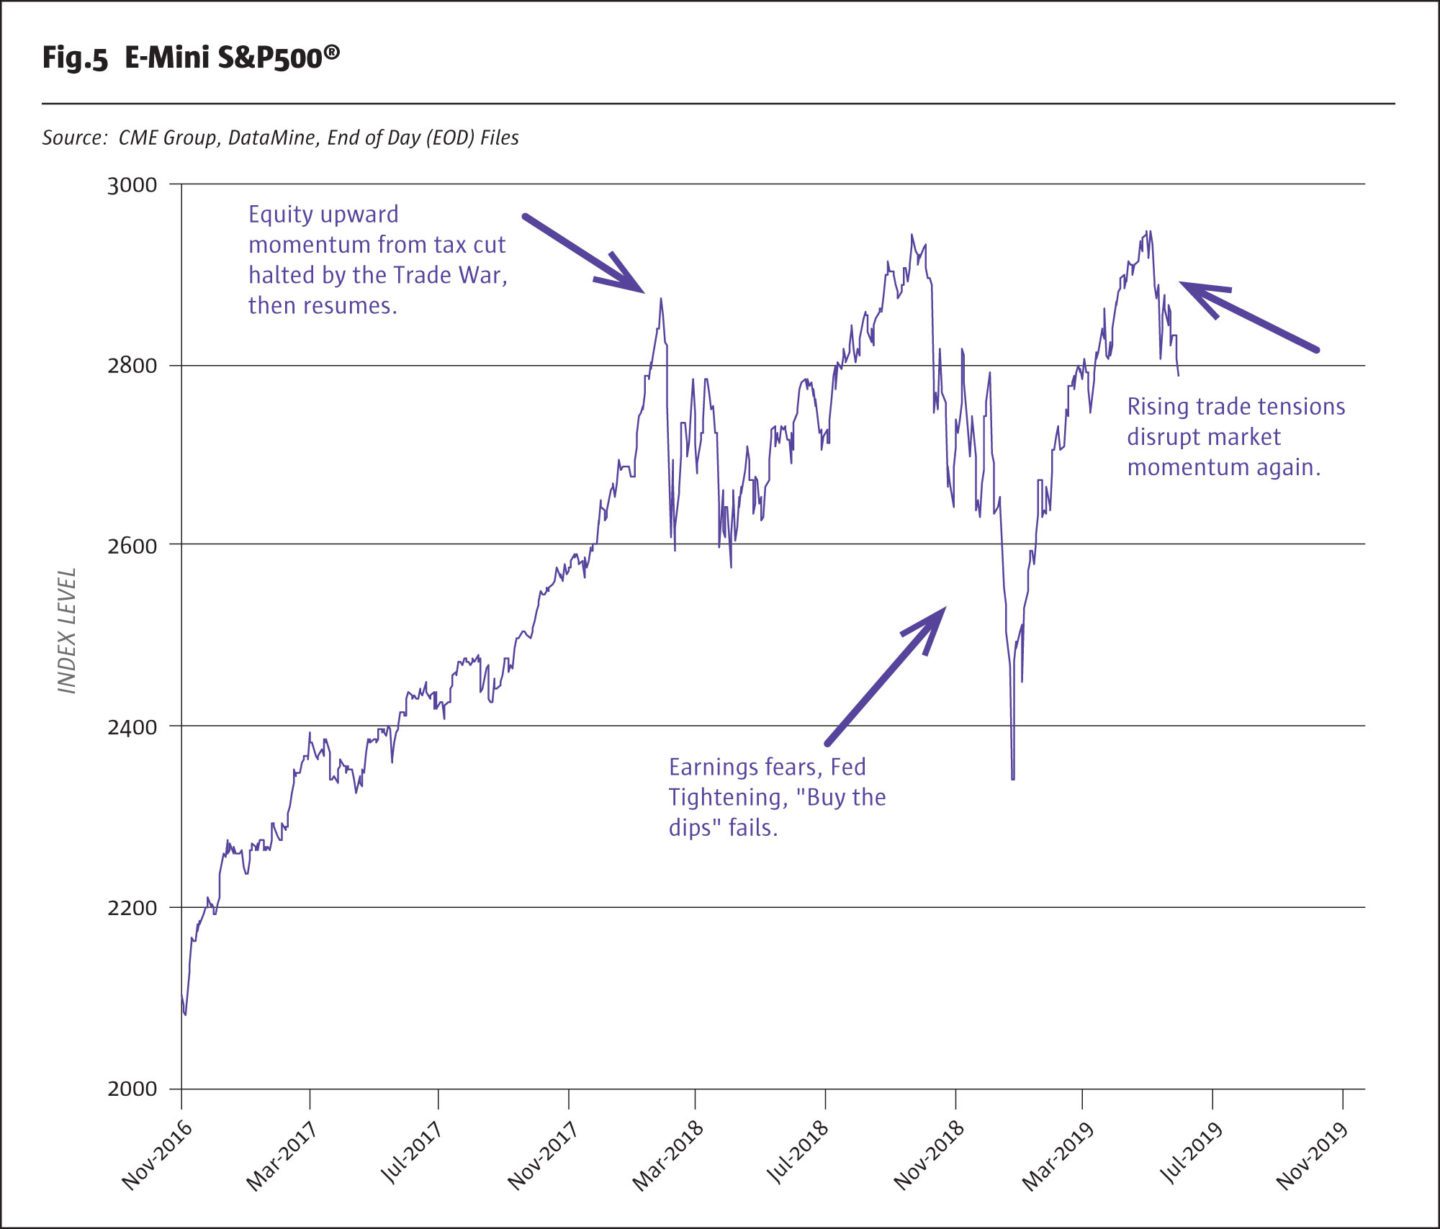
There is no question that the US-China trade war has entered a new and escalated phase. Both sides are dug into to what increasingly looks like a lose-lose situation for global economic growth. The recent trade war developments have halted the upward momentum in US equities. There has been selling pressure among stocks impacted by the trade war, as well as defensive moves into high-dividend stocks. What there has not been, at least through the end of May, is any signs of panic selling. Markets have been orderly and a repeat of the rapid stock price deterioration of Q4/2018 has not occurred. Our interpretation is that equities are appropriately re-pricing risks associated with the companies most impacted by an escalating trade war, but equity markets are not shifting to a focus on an imminent recession. We do note that the Q4/2018 near-20% decline in US equities convinced the Fed to stop its lock-step path to higher rates and shift to a policy of keeping rates on hold for 2019. So, far the Q2/2019 equity pattern is in no way powerful enough to argue for a change in Fed policy or a rate cut.
Unusual shape of the yield curve
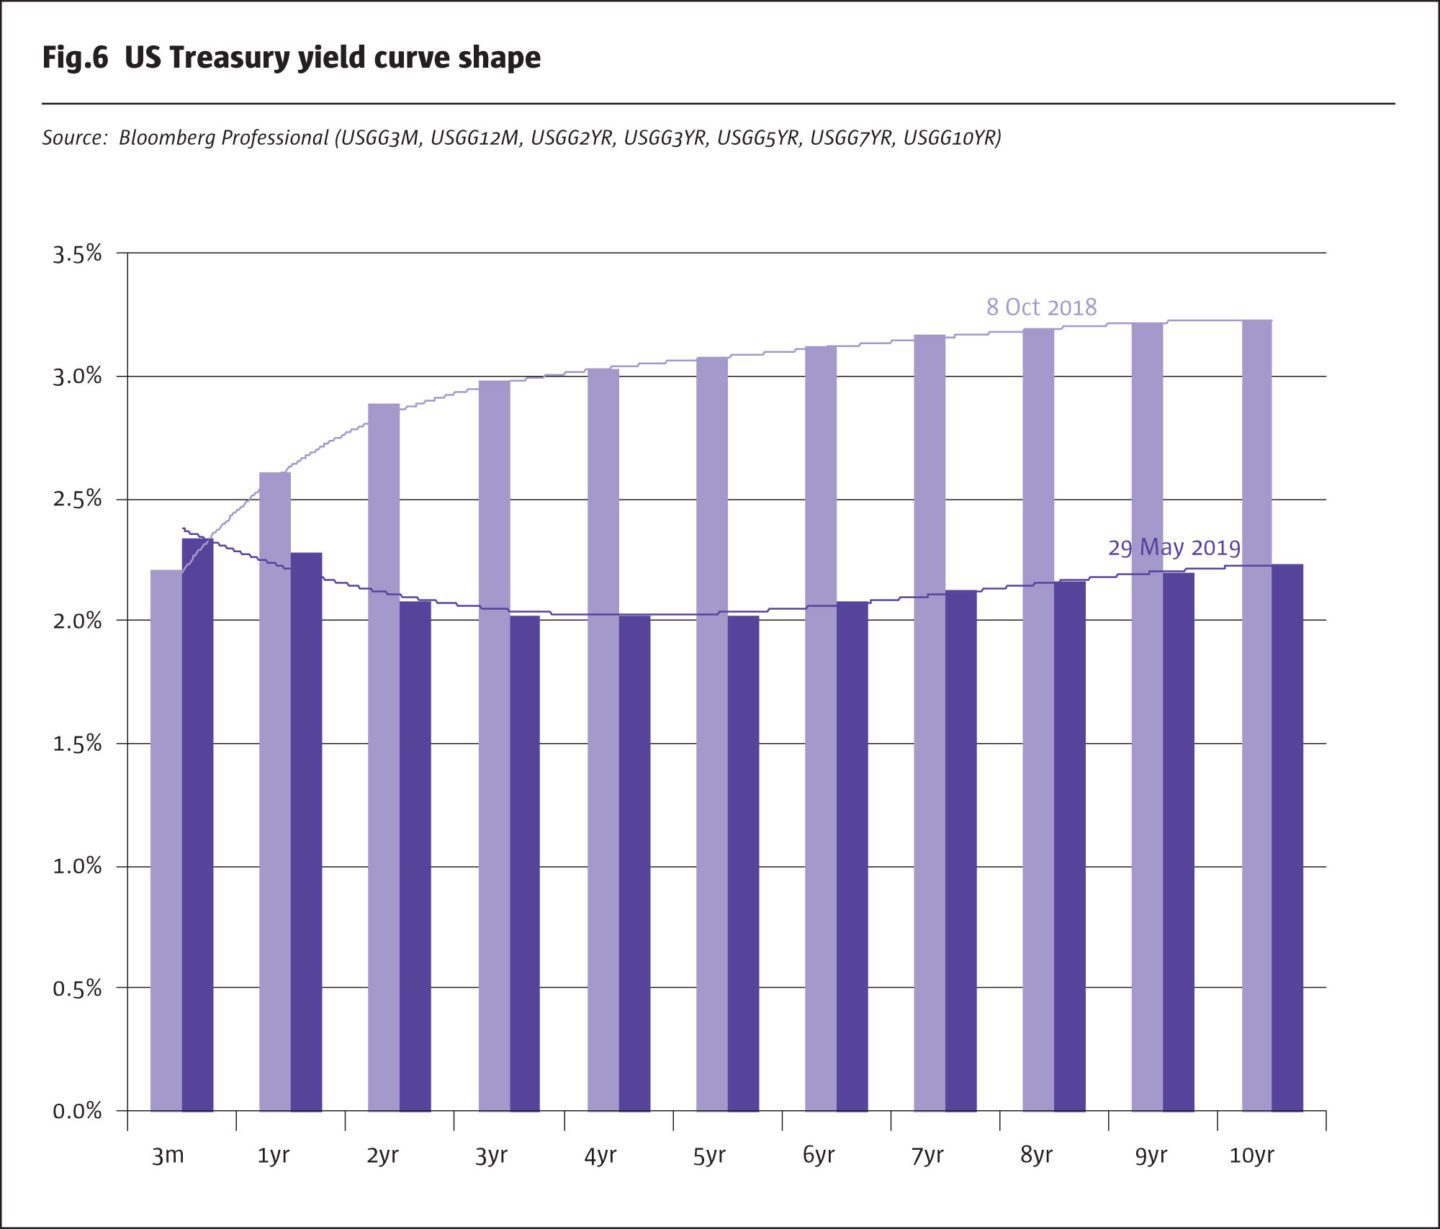
The US Treasury yield curve has an unusual shape. Back in early October 2018, just as the equity swoon was getting started, the yield curve had a modestly positive slope, with short-term yields below long-term yields. Now, at the end of May 2019, the curve is inverted, short yields above long yields from the overnight federal funds rate (at 2.40%) and 3-month T-bills through to the 5-year Treasury Note (at 2.03%). The 5-year yield is the low point, however, and as maturities increase to 10 years and longer, yields move back to a very modestly positive slope.
When the full yield curve is flat or inverted, history has shown that more equity volatility and a potential recession may lie 12 to 24 months into the future. Market participants ignore yield curve warnings at their peril. We have certainly seen more equity volatility. But does the short-maturity inversion signal a future recession when the long maturities partially disagree?
We would go with the conclusion that the yield curve is signalling that US and global economic growth is decelerating, but at this point forecasting an imminent US recession seems a stretch. We must point out that when the Q2/2019 US real GDP data is published at the end of July 2019, it will mark this expansion as tying the record for the longest on record. And the unemployment rate is still below 4%. The Fed may well be worried, but probably not worried enough to cut rates any time soon.
Bottom line
• The Fed is data dependent.
• A data-dependent Fed will not anticipate economic weakness, not from the trade war, a flat yield curve, a government shutdown or debt ceiling crisis, or any other cause.
• A data-dependent Fed means the Fed needs to see inflation persist below 1% for a few months, or observe a recessionary quarter before it will cut rates.
• If inflation is headed below 1% and/or recession occurs, however, the Fed would not cut rates by 0.25%. We predict it would go full-bore to take the federal funds rate to 1% in just one or two meetings of the Federal Open Market Committee (FOMC), or maybe make one big cut in an emergency unscheduled FOMC meeting. The step-wise path of rate rises is not the pattern for rate decreases.
All examples in this report are hypothetical interpretations of situations and are used for explanation purposes only. The views in this report reflect solely those of the authors and not necessarily those of CME Group or its affiliated institutions. This report and the information herein should not be considered investment advice or the results of actual market experience.
- Explore Categories
- Commentary
- Event
- Manager Writes
- Opinion
- Profile
- Research
- Sponsored Statement
- Technical
Commentary
Issue 141
Interpreting the US Bond Rally
June 2019
Blu Putnam, Chief Economist, CME Group
Originally published in the June | July 2019 issue