One of the main principles to build portfolios of financial assets is to achieve stable long-term performance and avoid large drawdowns. This article describes how a method of Machine Learning, Kohonen’s Self-Organising Maps, can be applied to visualise risk and to build robust portfolios of hedge fund managers. Essentially, it documents a feasibility study that was conducted to gauge whether Machine Learning can add any value to the investment process of an investor in hedge funds.
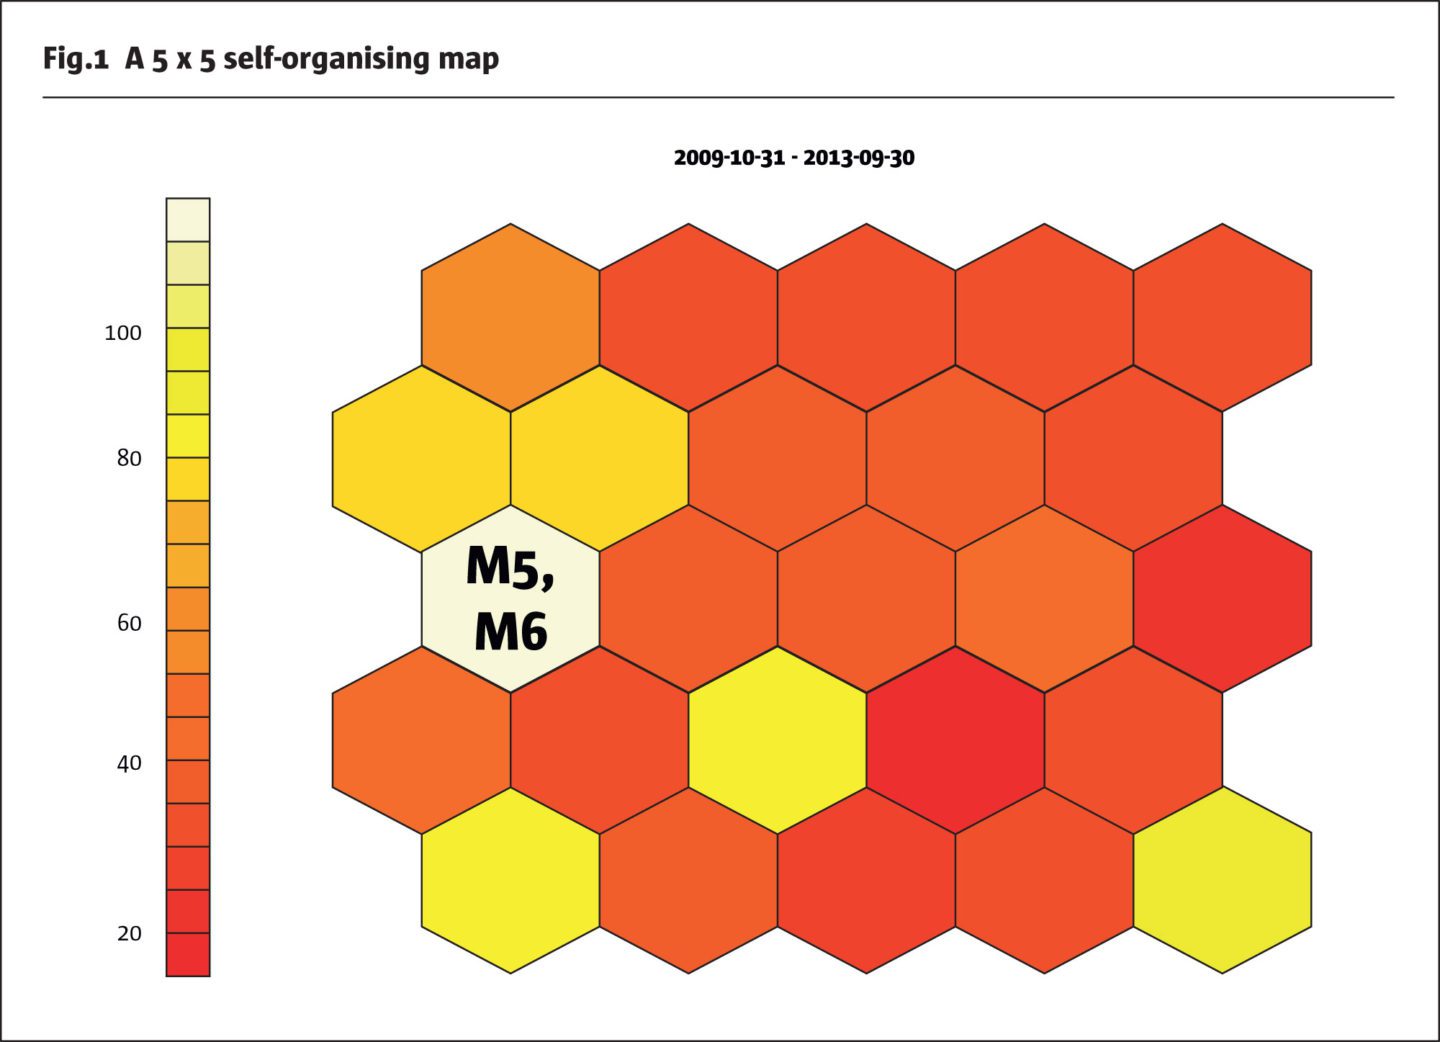
Robust portfolios can be created by avoiding concentrations and by diversifying across hedge fund managers and hedge fund styles: a portfolio comprising only, for example, long/short equity managers will suffer larger drawdowns when equity markets fall than a portfolio that invests partly also, for example, in credit or macro strategies. How can we avoid concentrations in the portfolio? A statistical tool for identifying similarities in data are the Self-Organising Maps (SOM). SOM were developed in the 1980s by Teuvo Kohonen (Kohonen, 1982). They project objects onto a 2-dimensional map with similar objects being placed closely together. SOM can be used to identify similarities in risk behaviour of hedge funds: managers with similar risk behaviour and hence similar investment strategies appear on near-by units, i.e., near-by areas on the map. A potentially important feature of SOM is that they are able to exploit non-linearity in the data, as hedge funds deploy trading strategies and instruments that lead to non-linear return profiles. SOM can be interpreted by visual inspection and can process incomplete and noisy data. The tools required for Machine Learning have become commoditised, as several toolboxes are available free on the internet. All network training and calculations discussed here were conducted with the R package “kohonen”. Fig.1 shows a SOM with 5 x 5 = 25 units which was created with hedge fund return data from Oct 2009 to Sep 2013 (48 months). We call this 4-year period vintage year 2014. Vintage year 2008 would comprise the 48 monthly returns from Oct 2003 to Sep 2007, etc.

The 2 managers M5 and M6 exhibit similar return profiles and hence appear on the same unit, here unit 11. The counting of the units starts with unit 1 at the bottom left, unit 5 at the bottom right, the unit in the middle of the map has number 13, unit 21 is in the top left corner and unit 25 in the top right corner. The colours in Fig.1, explained by the scale on the left, represent the number of hedge funds that were mapped onto the 25 units. For example, unit 21’s colour orange tells us that about 60 managers were mapped onto this unit. Unit 11 is the busiest unit with ca. 110 managers mapped onto it. Most managers occupy the left part of the SOM, while fewer managers are in the upper right part of the SOM. If a portfolio would only comprise managers from the left part of the SOM, risk would be concentrated in similar hedge fund strategies and little diversification could be expected in times of drawdowns. In addition to hedge funds, any other instruments, like equity, bond or commodity indices, can be integrated into the SOM. If the S&P500, for example, also shows up on the busy unit 11 it is clear that many managers follow trading strategies that produce a similar return / risk profile as equity markets. Investors seeking diversification away from equities would therefore look at managers mapped remote from unit 11.
Portfolio selection with SOM
Applying the SOM for risk analysis seems sensible, but how can it be used for manager selection? We suggest one method, which we call SOM_REMOTE (other methods are available, but are beyond the scope of this article, see Huber (2018)). 12 managers are selected according to the following scheme:
A SOM with 25 units (5 x 5) is created. Managers are selected from the most remote units of the SOM, i.e., from the 4 corner units in the bottom left (unit 1), bottom right (unit 5), upper left (unit 21) and upper right corners (unit 25), together 12 managers. The idea is to pick managers with high diversification potential.
To gauge whether SOM_REMOTE helps to enhance risk management, a comparison with simple benchmarks is useful. To this end, we simulate 2 ways to construct benchmarks which are both independent from the creation of SOMs:
1) Method Free: Randomly pick 12 managers from the universe of the corresponding vintage year. In theory, all managers could come from the same style (e.g., long/short equity). Method Free allows for unconstrained selection of managers.
2) Method Style: Each of the 12 randomly picked managers needs to come from a different self-declared style. This ensures minimum diversification based on the self-declared styles of the managers. The styles, like long/short equity, event driven, or short-term trading, are taken from Barclay Hedge. There are 80 styles in the database. All managers are categorised according to one of those self-declared styles.
Basis for the simulation experiment is the Barclay Hedge database comprising monthly returns from 2003 to 2014. Our focus is on single hedge funds, hence funds of funds were excluded. After applying several filters, for example, minimum assets under management USD 50 million and a minimum of 48 months of data, each vintage year ca. 1,000 managers fulfil the filter criteria and form the universe for training the SOM.
The simulation experiment involves training a SOM for one year, randomly drawing 12 managers based on the 3 methods and measuring out-of-sample performance for the following year. All managers were equal-weighted. For each of the 7 years from 2008 to 2014 and each method, 10,000 portfolios were randomly drawn. In total, 3 * 7 * 10,000 = 210,000 portfolios were simulated.

Empirical results
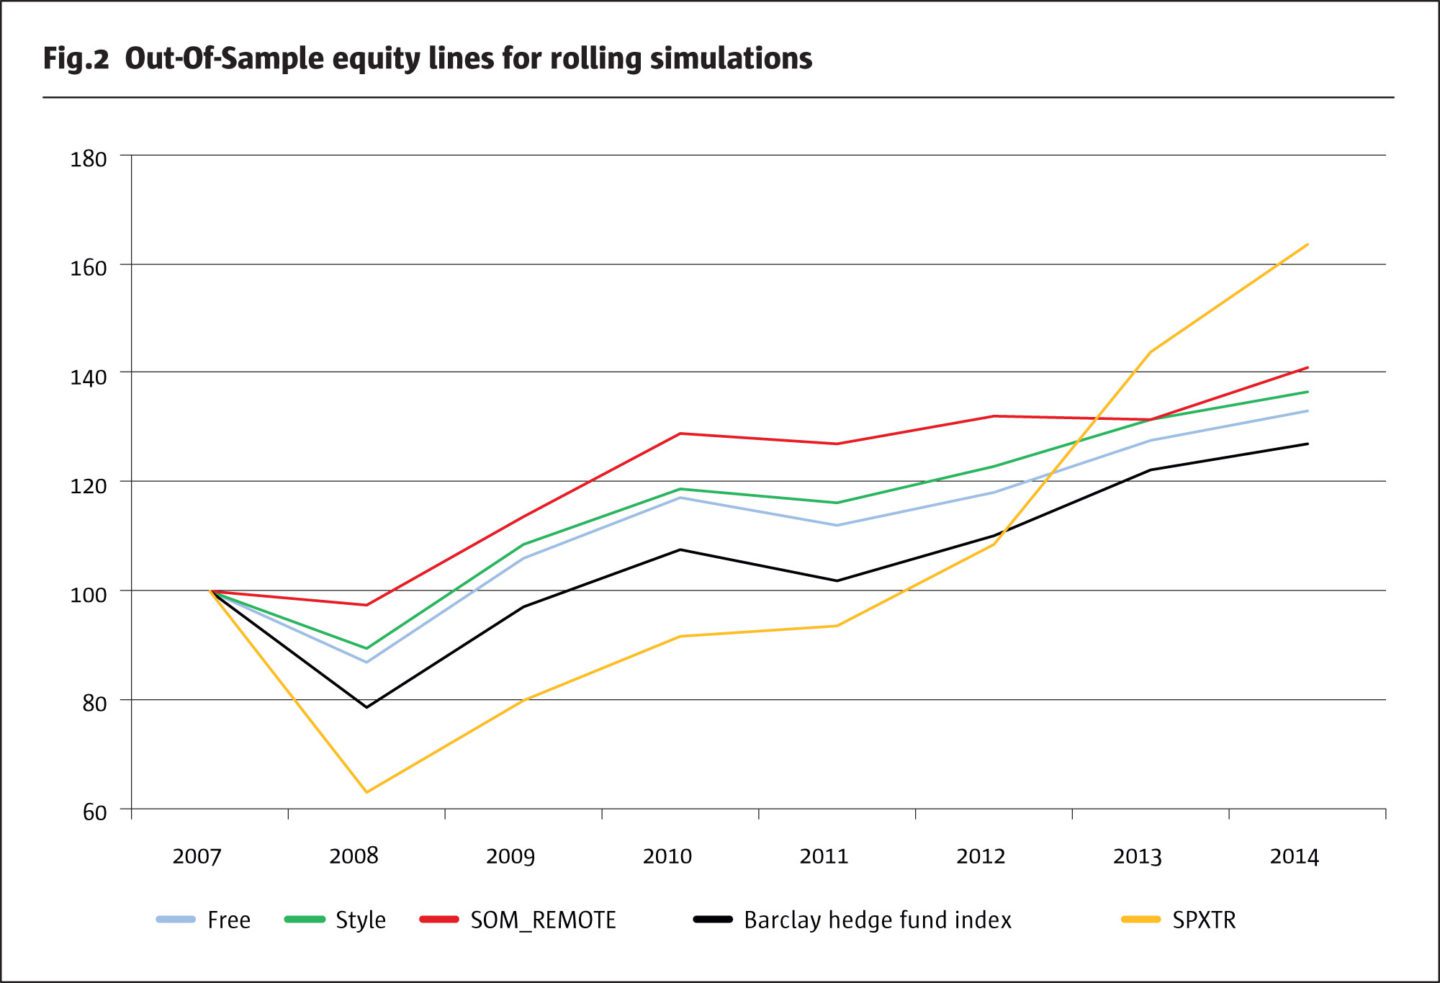
Fig.2 displays the equity lines for annual out-of-sample performance. Each annual point on the equity lines for the 3 methods is the average over all 10,000 simulations for one vintage year. Fig.2 also includes the 2 additional benchmarks Barclay Hedge Fund Index, an equal-weighted average of the Barclay Hedge Fund universe, and S&P500 Total Return Index (=SPXTR).
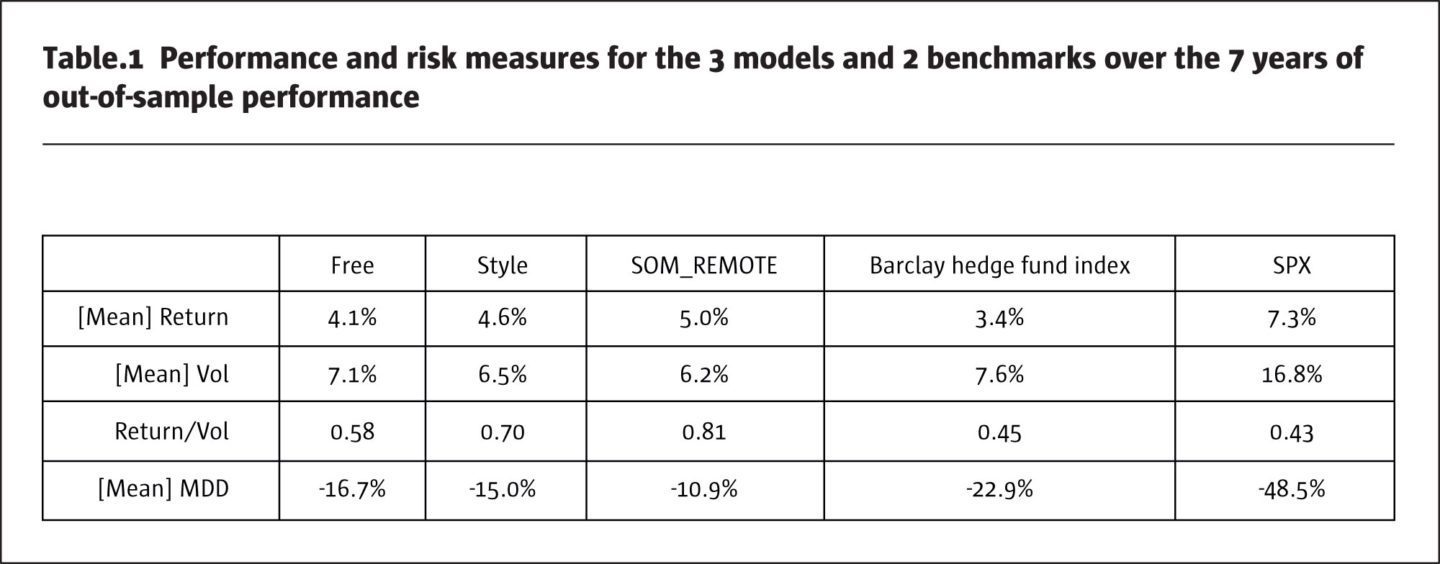
Best performer based on the equity line only is SPXTR with an index level of 163 in Dec 2014, followed by SOM_REMOTE (141) and Style (137). SPXTR experienced the largest drawdown in 2008 of -37%, followed by the Barclay Hedge Fund Index (-22%). The simulated hedge fund portfolios show less severe drawdowns in 2008: the worst is from Free (-13%), followed by Style (-11%) and SOM_REMOTE (-3%). SOM_REMOTE mitigates the negative performance in 2008 massively and is the most stable performer: it generates low drawdowns but lags in years of equity market recovery (2012, 2013). Table 1 provides an overview of different risk and performance metrics.

Mean returns increase from Free over Style to SOM_REMOTE. Volatilities decline in that order. The ratio Return / Vol climbs from Free (0.58) to SOM_REMOTE (0.81). This is equivalent to an increase of 40%. In terms of Return / Vol ratio, the 2 benchmarks SPXTR and Barclay Hedge Fund Index are behind at the back: SPXTR generates by far the highest return at +7.3%, but at the cost of much higher volatility (16.8%) than the others. This results in the least favourable Return / Vol ratio of 0.43. The Barclay Hedge Fund Index achieves the second-lowest return at 3.4%, but at the second-highest volatility of 7.6%. Its Return / Vol ratio at 0.45 is only slightly higher than SPXTR’s.
The row “[Mean] MDD” in Table 1 gives the mean Maximum Drawdowns over the 10,000 simulations. The general pattern is that Free has the highest MDD at -16.7%, which declines from Style to SOM_REMOTE at only -10.9%. The MDDs of the 2 benchmarks SPX at -48.5% and Barclay Hedge Fund Index at -22.9% are far behind. The Barclay Hedge Fund Index experiences a higher MDD than Free.
Summary and outlook
Machine Learning and Self-Organising Maps can be deployed to visual risk analysis and selection of hedge fund managers by identifying similarities in the return structures of hedge funds. For example, it can be expected that 2 managers following a long/short equity strategy generate similar returns. Based on their historical returns, hedge funds with similar return profiles are mapped onto the same or near-by units of the SOM. By analogy, managers that are based on remote parts of the SOM exhibit dissimilar return structures and hence can be regarded to diversify each other.
We suggest a simple method to exploit the SOM feature of identifying similarities in high-dimensional data: managers are selected from the 4 most remote parts of the SOM, i.e., the units in the lower left, lower right, upper left and upper right corners (called method “SOM_REMOTE” in the article). In discussions with clients it has turned out that the way SOMs work as well as the method to pick managers from remote areas of the SOM can be intuitively explained and understood, which increases acceptance by practitioners.
The SOM-based selection method is compared to 2 simple benchmarks: 1) in method “Free”, managers are picked randomly from the whole universe without any restrictions. In theory, all managers in a portfolio could come from the same style. This constitutes the most basic way to select hedge funds. 2) Method “Style”: each manager selected must follow a different self-declared style based on the Barclay Hedge style categories. This selection procedure is meant to establish a minimum diversification across hedge fund styles. A simulation experiment, where random portfolios were constructed from randomly picking managers according to the SOM-based method and the 2 benchmark selection approaches shows that risk/return metrics indeed improve from methods “Free” over “Style” to “SOM_REMOTE”. SOM_REMOTE reduces drawdowns noticeably, which leads to strongly enhanced risk/return measures.
Apart from hedge fund selection, Machine Learning and Visual Risk Analysis can also be deployed for style drift analysis, benchmarking, fraud detection and bankruptcy prediction.
The simulation experiment described in this article is meant to show that SOM in general can add value to the investment process for hedge fund selection. In our simulation experiment, managers were picked randomly from a SOM and then equal-weighted in a portfolio. For sure more intelligence can be applied here, for example, by focusing on managers with the capability to generate alpha over a set of risk factors. Alternatively, a benchmark to measure alpha against could comprise all managers mapped onto one unit. An example for a practical investment process could be to run SOM as an initial step to identify managers with unique strategies. Those can, for example, be purchased in a stand-alone portfolio that is meant to perform stable. Or they can be added as a sub-portfolio to an existing portfolio. Rather than equal-weighting managers in a portfolio, as in our simulation experiment, more sophisticated portfolio construction mechanisms could be deployed. One example in this regard is to use optimisation algorithms that take the specifics of hedge funds, like non-linear return profiles, into account.
Apart from portfolio selection SOM can also be applied for risk analysis. As shown in Fig.1, many managers produce similar return profiles. If the managers of an existing portfolio come all from the same part of the SOM, there is little diversification to expect in times of crisis. A SOM can help to make the return profiles of hedge funds more transparent and to find diversifiers to an existing portfolio – those could come from a remote part of the SOM. SOM can also be deployed to check whether the self-declared style of one manager actually matches this style’s expected return structure. If, for example, a convertible arbitrage manager would be assigned to a unit close to trend-followers, this would give a good reason to ask a few questions. Managers that declare to belong to a certain strategy should exhibit return structures similar to other managers following that style – or they should be able to explain why they deviate. Closely related to that sort of style analysis is benchmarking, where all managers on one unit or near-by units could be defined as benchmark constituents. Apart from a clear visual interpretation such a benchmark would also incorporate non-linear risk, definitely an advantage when dealing with investments involving derivatives and hedge fund strategies.
Another application of SOMs is the detection of style drift. To this end, 2 SOMs need to be trained on 2 non-overlapping different periods, for example, a) 2015 to 2016 and b) 2017 to 2018. If our convertible arbitrage manager can be found on SOM a) close to other convertible arbitrage managers and on SOM b) closer to equity strategies, this might be a hint that this manager has taken more equity risk than his peers.
The SOM can also be helpful for risk analysis of an existing portfolio with investments where no valuation model is available (black box investments). This could involve derivatives, for which prices, but no valuation model is available, or hedge funds for which no position transparency exists. Inputs would be historical returns of the portfolio’s instruments, together with a few benchmarks, like the S&P500, bond or commodity indices. The trained SOM could visualise which instruments, like derivatives or hedge funds, behave similar to the benchmarks. If many instruments are mapped onto the same units, as seen in Figure 1, there might be risk concentrations in the portfolios. The SOM is particularly useful in this case as it can process non-linearity in returns (derivatives, hedge funds) and can visualise the risk of black box investments and help to integrate it into a risk framework.
Other instances for applications in finance are bankruptcy prediction, where inputs are balance sheet ratios. The SOM will place corporates with similar balance sheet structures on the same units, for example, A-rated entities would be close together on near-by units in the upper left corner, while C-rated ones would be assigned to units in the bottom right. Fraud detection could work in a similar fashion, for example, to uncover credit card fraud. Inputs could be data that describe regular customer behaviour, and the SOM can help to detect outliers. Typically, there will be one area of the SOM, for example in the bottom right corner, where customer behaviour differs from the rest of the SOM. If customer vectors are mapped onto this area they exhibit divergent or fraudulent behaviour.
In summary, some of the specific features of SOM, like their visualisation capabilities and their possibilities for interpretation, their ability of dealing with non-linear and noisy data can help to enhance investment processes.
References
• Huber, C.: Machine Learning for Hedge Fund Selection, talk presented at the conference “AI, ML and Sentiment Analysis applied to Finance”, June 2018, London, available at www.rodexrisk.com/?page_id=431,.
• Kohonen T. Self-organized formation of topologically correct feature maps. Biological cybernetics. 1982 Jan 1;43(1):59-69.
- Explore Categories
- Commentary
- Event
- Manager Writes
- Opinion
- Profile
- Research
- Sponsored Statement
- Technical
Commentary
Issue 134
Machine Learning
For visual risk analysis and hedge fund selection
Dr. Claus Huber, CEFA, CFA, FRM, Rodex Risk Advisers LLC, Altendorf SZ, Switzerland
Originally published in the July | August 2018 issue