
Execution in many markets has become more challenging, especially for those lacking the wherewithal to manage the complexity. Liquidity, which gauges ease and efficiency of execution, has generally been deteriorating. Highlighting just one relatively simple metric used to gauge visible liquidity, average quote sizes in E-mini S&P futures have been declining over multi-year periods, independent of the macroeconomic and broader financial market climates of risk on/risk off and quantitative easing/quantitative tightening by central banks.
Quantitative Brokers (QB) defines periods of long-term changes in microstructure variables as regimes. Regimes can last for days, weeks or months, and broadly speaking QB judges that the regime has been “challenging” since November 2021 for most of the FICC markets the firm has been analysing since inception in 2010 (and longer including its founders’ prior careers in banking). A challenging regime involves not only smaller quote sizes, but also more volatility, wider bid/offer spreads, and other problems to manage, which can be market specific.
Throughout all sorts of regimes, QB’s proprietary, custom-built algos are tailored to the niceties, nuances and quirks of futures markets, such as hidden liquidity; implied liquidity; futures matching engines; market specific tick sizes and rolling contracts over term structures stretching out years.
Some markets, such as the S&P 500 and the VIX, could be highly correlated over a full trading day, but not necessarily over a half day trading period.
Dr Robert Almgren, Chief Scientist and Co-Founder, QB
What makes execution still more complicated is that within any regime, microstructures also vary intraday due to seasonality (such as night and day) and around events such as economic data releases. These shorter-term shifts are called “states”. To add to the complexity, the market states are not exactly time dependent, but can vary based on the exchange and instrument.
Fortunately, advances in mathematics, statistics and technology are powerful tools to clean complex and noisy datasets to identify regimes and states, and generate subtle, adaptive analytics and algorithms that can be used to optimize pricing, liquidity and workflows. A proactive approach can harness these tools over the whole trade life cycle, from pre-trade planning and forecasts of costs and market impact to post-trade transaction cost and performance analysis. Increasingly, traders also carry out preparatory research and simulation exercises to estimate or extrapolate costs and map out tactics before executing in new markets.
From stochastics to clusters
Maths, data and computer power have made quants more confident about categorizing market regimes and states. “Twenty years ago, liquidity and volatility were stochastically modelled as being random, and optimal trading strategies might speed up or slowdown in different markets. This was better than nothing, but now more advanced techniques are available, calibrated to clusters of market regimes, states and parameters,” says Chief Scientist and Co-Founder, Dr Robert Almgren, who has been active in the space for over 25 years, including authoring academic papers.
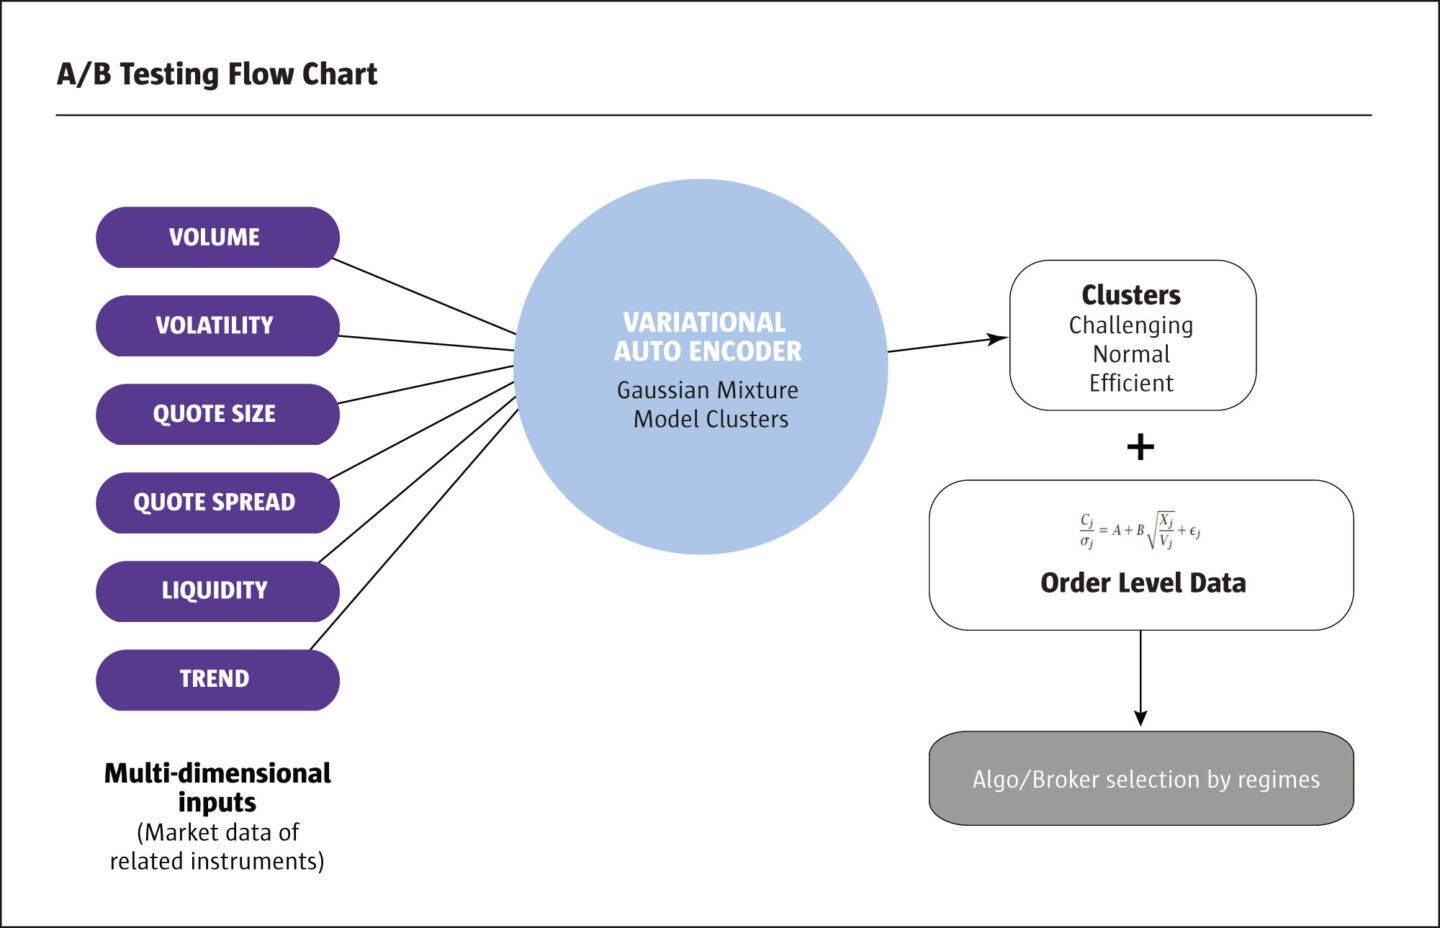
In broad brush terms, regimes can be split between efficient, normal and challenging. “Regimes can be defined by the quality of price discovery, in terms of whether there was efficient, easy and orderly price discovery with reasonable prices and transaction cost slippage. Heatmaps can identify more challenging regimes, with thinner markets and more volatile price discovery that requires a different approach,” says CEO and Co-Founder, Christian Hauff.
Adding dimensions of microstructure definition
Microstructure analysis can be based on ten or fifteen inputs per market, and the weighting formula adapts with regimes. “Variables include average quote size, average spread size, realised volatility and realised volume. They can be grouped into clusters that help to identify different market states,” says Hauff. The standard, plain vanilla measures of volatility, liquidity, spreads and order sizes can also be modified into more elaborate metrics conditioned with one or more other variables.
Market states at day, night and intraday
“Market states are different outside regular trading hours. Trading the S&P 500 Futures at night requires different parameters and values, and limit order placements need to be adjusted accordingly,” says Almgren. “Market states can vary seasonally and there are special event related states intraday, such as when economic data, like inflation or non-farm payrolls, is released”, says Head of Research, Shankar Narayanan.
The day versus night states also differ between markets. “In energy markets such as oil or gasoline, correlations are higher during the day than at night. Conversely, in bond markets, correlations tend to be higher at night, because there is rarely any country-specific news-flow such as economic releases,” points out Almgren. There are further nuances within intraday periods. “Some markets, such as the S&P 500 and the VIX, could be highly correlated over a full trading day, but not necessarily over a half day trading period,” explains Almgren.
Traders should not necessarily expect to make predictable generalisations about states. On average, quote sizes are lower at night than during the day, which intuitively might suggest slippage should be higher at night. That was the case in 2022, but the reverse applied in 2021, during a relatively more efficient regime, according to QB’s recent QuantBrains seminar.
Tailoring regime and state definitions to markets
These multiple and dynamic dimensions of microstructure can result in noisy datasets that make it difficult to discern regimes and states. Whereas a traditional k-means statistical technique may struggle to identify non-linear patterns amid noise, machine learning and reinforcement learning techniques, such as variation automation encoding (VAE) techniques, are more adept at picking up such relationships. “VAE techniques can sometimes identify multiple market regimes or states in a single trading day, second by second or minute by minute,” says Narayanan.
VAE is also useful in calibrating the mix and blend of microstructure indicators to markets, which can involve using Principal Component Analysis to break down datasets into clusters. “The choice and weightings of dimensions varies between markets. Volatility can have a higher weighting for interest rates and spreads can be more important for commodities. VAE techniques are useful to identify non-linear and noisy relationships that cannot be captured from simple methods,” adds Narayanan.
Transitions between regimes and states
Traders, investors and algorithms need to adapt and respond to transitions between states. Identifying these shifts in massive datasets marks an advance in analytics that allows for more accurate insights. Continuous, dynamic application of regime and state identification is enabled by computer capacity, datasets and reinforcement learning techniques.
The genesis of the VAE techniques was a client who wanted to start trading in Japanese equities and wanted to estimate cost inputs for models by interpolating and extrapolating from other markets.
Dr Robert Almgren, Chief Scientist and Co-Founder, QB
Microprice forecasting and optimizing limit order tactics
One application of these techniques is limit order tactics. “Algorithm adaptivity is considered both for up and down price moves, and for multiple other dimensions, such as speed, liquidity and volatility. This can lead to forecasts of quote levels and stability for micro prices, which are the internal architecture of asset prices. We interpolate prices between bid and offer quotes, and weight them by the size of quotes. These are reasonable estimates of fair value and can indicate where the market sees value in a spread. These micro prices tend to move up before prices move up,” says Almgren.
Stability is especially important for those needing to execute a large order. “Micro prices can be used to determine if quote levels are stable or unstable, and therefore whether prices might move up and then quickly revert or might move down because they did not attract enough volume,” explains Almgren.
Micro price forecasts inform choices about how to size limit orders and at what price levels they are placed, in different market regimes and states. “For example, the objective is sometimes to “cross the spread”. At other times the analysis may reveal a quote or order flow imbalance, which requires different tactics. An imbalance can change the probable market impact that orders of different sizes may have. This is partly because the order imbalance itself could be amplified or reduced by subsequent orders. Adding, cancelling or removing liquidity can shift the order imbalance,” says Almgren. Algorithms develop complex signals based on multiple scenarios to determine responses.
Advances in simulation techniques
QB has developed proprietary techniques and simulators for testing new models, releases, markets and functionality. “This is designed to mimic real-time trading and give new users a test drive, including transaction cost analytics,” says Hauff.
Commission-based execution and standalone analytics
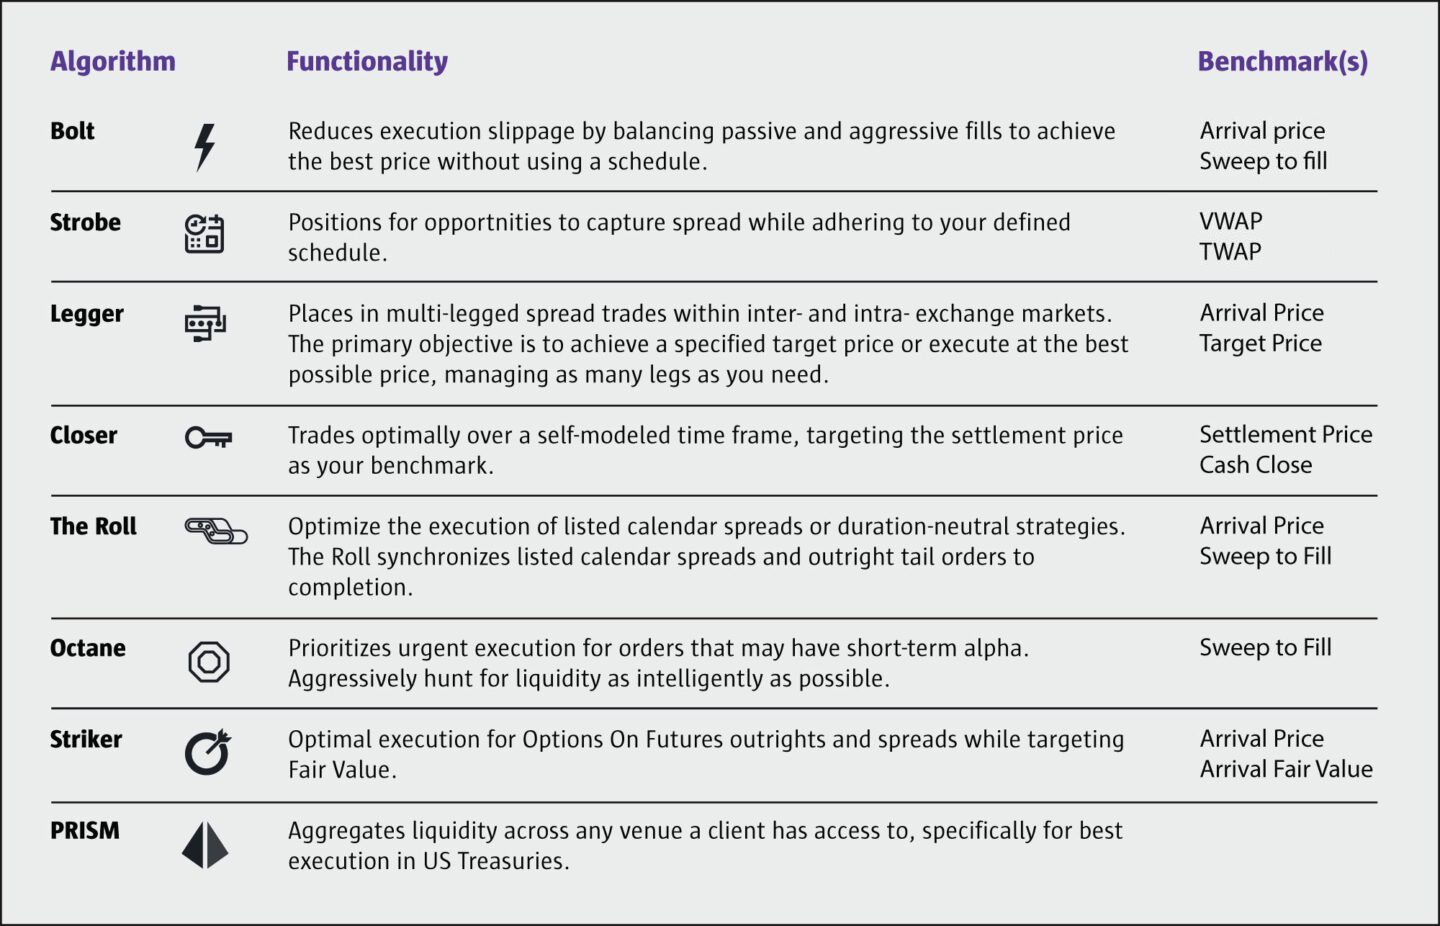
QB’s core business model is based on charging commission for execution, and clients aim to save more than their commission costs through improvements in execution quality. Defining best execution benchmarks is not a standardised process. “Algos are tailored to options on futures, implied quotes and implied price calculations. Multi-legged trading has many nuances. The objectives may be to get the best price, a threshold price, or a yield curve differential such as 5 year versus 10 year,” says Almgren. Generically there are eight execution benchmarks (Arrival Price; TWAP; VWAP; Target Price; Cash Close; Settlement Price; Sweep to Fill (STF); and Arrival Fair Value. Different client needs can lead to a wider variety of benchmarks, which change over the life of a trade, and can be blended.
Electronic execution is not just about optimizing price but also about locating liquidity and efficiently automating workflows. “It is easy to build algorithms, but harder to plug them into workflows, coordinate with clearing counterparts and meet risk and transparency requirements along the way,” says Hauff.
There is considerable client demand for deeper conversations and engagement around performance. Now, specialised data and analytics can even be offered as a standalone service, QB Analytics. Cleaning, synchronising and validating data is an important exercise that feeds into algorithm wheel analysis. QB can act as another third-party check.
QB’s client base has always been hedge fund heavy, but has broadened out to include other asset managers, corporates trading commodities and some top tier banks.
Cloud computer power empowers the simulation environment with technology and data capacity, since huge historical datasets are needed. This allows for optimisation of algorithm configurations to highlight their valued and select optimal solutions for client bases or user groups. Historical simulation can be used for pre-trade cost models of market impact, continuously updated based on trade data. This can also be filtered through lenses of regimes and market states, to increase precision.
For instance, a special challenge exists when there is plenty of market data but not enough order level data. “The genesis of the VAE techniques was a client who wanted to start trading in Japanese equities and wanted to estimate cost inputs for models by interpolating and extrapolating from other markets. The VAE model used market micro parameters, grouped them with similar products, and interpolated and extrapolated from other markets,” says Almgren.
The aim is to learn lessons from the behaviour of other equity index futures. “The Japanese Nikkei index future is somewhat correlated with other futures, and statistical techniques can therefore identify to what degree the Dax or Nasdaq indices might have explanatory power for the Nikkei. Each cluster identifies what percentage of a market could be explained by other markets and lets us make a projection. Combinations of multiple indices generate heat maps and cost estimates for modelling volatility, volumes and costs. These extrapolations can then be compared against realized, actual data. There is a relationship between execution costs for different indices, but it is not linear, and therefore correlation is not the right word,” says Narayanan.
For the Nikkei futures, the estimates turned out to be very accurate, but also more varied than some investors might intuitively imagine. Naturally, the price correlations were very high, but execution tactics need to be tailored to the microstructure. “Of three different Japanese equity index futures, listed in Singapore, Chicago and Tokyo, one was most similar to the S&P 500 and one was most similar to the Nasdaq in terms of their microstructure behaviour,” says Almgren. “The VAE techniques had also been tested on Australian interest rate futures and equities,” he adds.
The extrapolations can be used for groups of markets or instruments that have similar microstructure, such as gold, silver and copper. The techniques can also be applied to more heterogeneous groups of instruments. As usual, the approach is further filtered according to efficient, normal and challenging regimes.
It is important to stress that no part of the system is machine learning. Parameters are calibrated offline with common sense.
Dr Robert Almgren, Chief Scientist and Co-Founder, QB
Multiple algorithms, configurations and protocols
The next iterations are dynamically optimising the selection of algorithms, configurations of algorithms and brokers. The optimal choice of algo/configuration/broker will vary between regimes, and for wider or narrower spread instruments. The same algorithm can be configured to be more or less aggressive. For instance, a less aggressive configuration might work better in efficient and normal regimes but be more expensive in challenging regimes.
But as with investing strategies, a higher return approach may involve more volatility. One simulation showed the Strobe algorithm had better slippage than Bolt, but also a wider variance, which users need to have tolerance for.
Portfolios of algorithms
QB currently has a suite of seven algorithms. Sometimes a hybrid approach is needed, blending two or more algorithms concurrently. QB can optimise appropriate blends and send orders through a multi-algo engine. “QB uses different algorithms, such as Bolt and Strobe, for different regimes. A VWAP algorithm might beat an arrival price algo in some market conditions, while implementation shortfall slippage measures show more dispersion,” says Narayanan.
Some clients are even applying traditional investment portfolio management concepts to their choice and weighting of algorithms. “We can use mean variance optimization to arrive at efficient frontiers, and determine the weights of algorithms, based on regime states and alpha profiles. We analyse this dynamically in real time, using hourly, daily and yearly data,” explains Narayanan.
Realistically, not all clients have the wherewithal to use multiple algorithms (let alone all QB’s suite) and apply weightings to them. Some clients running less assets may also only have one or two brokers and do not necessarily want to analyse aggregate costs across multiple parties.
Dynamic correlations and multi-asset portfolios
Algorithms also adapt to the changing correlation matrix in markets, which can shift throughout the trading day. “This creates a framework for multi-asset trading where correlations can be low. The trading tactics to be passive or aggressive are adjusted for patterns of correlation. A passive approach accepts fills while an aggressive approach could cross the spread. When assets are highly correlated, quantities are kept closely related, but where correlations are lower there is no need to. The objective is to avoid the cost of crossing the spread,” says Almgren.
The over-riding importance of human judgement
Ultimately all these advanced techniques are all overseen by intuitively sensible human judgment. “It is important to stress that no part of the system is machine learning. Parameters are calibrated offline with common sense. A hefty dose of judgment determines when to use reinforcement learning for basket trading, and when to be passive or minimise tracking error. Everything is evaluated by humans, and nothing is fully automated,” says Almgren.
Expanding the coverage universe
QB’s techniques are applied to a growing universe of markets. The genesis of QB was as a first mover in efficient execution using specialised and agency algorithms for CME futures markets, and this steadily expanded to cover global futures and much of the FICC product universe, including options on futures, government bonds and even interest rate swaps. “Some markets that were historically very pit dominated are now electronically accessible,” says Hauff.
Throughout its life, QB has always taken pride in its open architecture, broker neutral and venue neutral best of breed model working with all major executing brokers, clearing brokers, FCMs, EMS and OMS. This means there are no artificial barriers to adding new venues, markets and instruments. “The universe rapidly expanded as we learned practices, positioning, workflows, industry and marketplace clearing in response to hedge fund and industry trends,” says Hauff.
Historically, central limit order book (CLOB) markets such as futures dominated the business, but a key milestone has been adding options on futures, government bonds and interest rate swaps. The new departure here is going beyond CLOB to add request for quote (RFQ) or request for stream (RFS) marketplace models.
“There is a lot of opportunity in these markets and lessons learned from other markets feed into them,” says Hauff. “There can even be dual protocols for the same venue where some markets can be accessed via CLOB or RFQ,” he adds. Smart order routers, such as PRISM, apply multiple protocols per venue and shift orders between venues. PRISM could use as many as four routers, which is something that could not be done by a human.
The next frontier: foreign exchange
These innovations have been partly enabled by cloud-based computer power, which is very scalable. This also sets the stage for applying techniques to larger datasets in foreign exchange markets. “It has taken QB years to start seriously contemplating currencies, because the original mission was interest rates, which then spread to cash Treasury bonds, and cash versus futures basis. FX is different and QB is developing its capabilities here,” says Almgren.
- Explore Categories
- Commentary
- Event
- Manager Writes
- Opinion
- Profile
- Research
- Sponsored Statement
- Technical