Can 2014 be called a good year for hedge funds? The answer to this apparently simple question is not altogether straightforward. In an effort to answer it, we used the powerful and flexible Aulexo analytics platform to look at a few common measures of performance and risk, assessing nine strategy groups from a universe of 5264 funds.
By looking at the results of analytics for individual funds, we were able to obtain a unique perspective on the effect 2014 had on the industry, as well as the distribution, probability densities and other statistical properties of each analytic across multiple strategies. This approach allows for a more holistic picture of individual strategies’ characteristics, rather than focusing on single benchmarks, which can deliver only a modicum of insight.
For the purposes of this article, we are using the S&P 500 index as a comparative benchmark to assess how specific strategies fared. Where the S&P 500 is displayed in charts, it appears as a broad and straight red line.

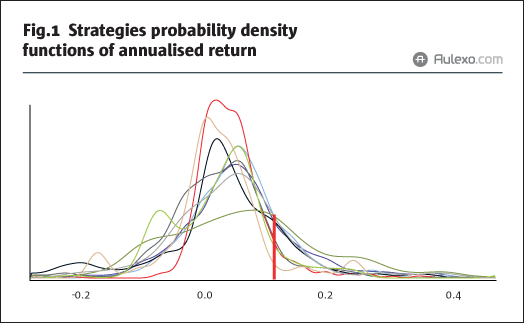

Perhaps the most frequently applied measure of hedge fund performance is the annualised return, and it is the best place to start when we look back at 2014. Fig.1 displays the distribution of annualised returns for each fund within each strategy, and the accompanying table (Table 1) shows the lower quartile (lowest 25% of values), the median and the upper quartile (the top 25% of values) of funds in each strategy group. As most would expect, US equities performed well last year, achieving an annualised return of 11.9%, and the index proved hard to beat for all strategies.
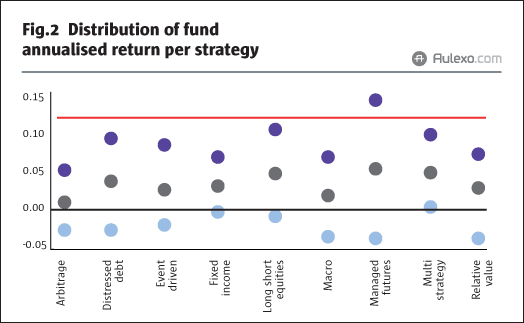

The purple dots on the corresponding distribution chart (Fig.2), indicate the upper quartile of funds, and illustrate how only in the managed futures strategy were more than 25% of funds (in this case slightly over 32%) able to beat the index. Yet managed futures was also a volatile strategy to be exposed to in 2014, a theme we will return to later. While slightly over two-thirds of funds in our universe made a profit, other strategies, while not capable of beating the S&P 500, saw more funds in positive territory: take fixed income, for example, with an 82% probability (Table 2) that any given fund in this strategy made a positive return, but with less than a 9% probability of beating the S&P 500. It is easy to understand why fixed income funds are a popular choice for investors concerned with wealth preservation in 2014.
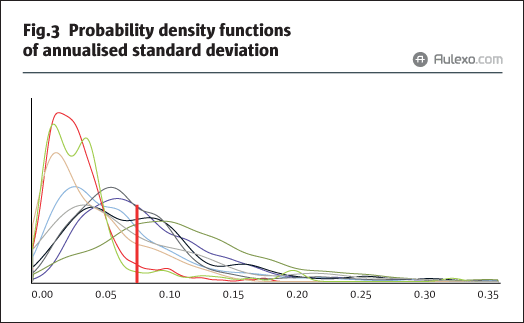

The volatility of the managed futures strategy is better demonstrated in the annualised standard deviation analysis for 2014: in Fig.3 we can see the considerable proportion of funds following a managed futures strategy (70%) experienced a higher standard deviation than the S&P 500.
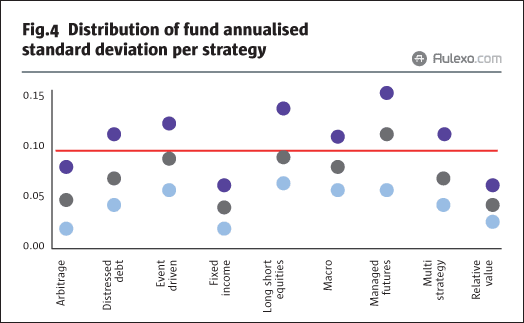

Managed futures was by far and away the most volatile strategy in 2014 (Table 3). By contrast, fixed income and relative value funds were most likely to experience lower volatility and, interestingly, both of these strategies show less variance of volatility between funds than other strategies, as can be seen from their interquartile range in Fig.4. While there is a probability of 54.6% that a managed futures fund has a volatility greater than 10%, there is considerable less chance that a relative value fund would have a similar volatility (8.3%) (Table 4).


Maximum drawdown (Fig.5 and Table 5) goes some way to supporting this thesis: over three quarter of managed futures funds (80%) saw a larger drawdown than the index (3.5%) – and no other strategy was subject to such drops.


Consider that 25% (the lower quartile) of managed futures funds saw a maximum drawdown in excess of 12.4% in 2014 (Table 6). Fixed income managers were able to shrug off much of the equity market-related volatility, with a probability less than 24% that a fixed income fund saw drawdowns greater than the index. Overall, fixed income managers were a less risky bet in 2014, as one would expect. What is unexpected is the size of maximum drawdown experienced by so many managed futures funds (Fig.6), given the fact that they typically trade in highly liquid markets, have accessible hedging securities and are generally less obliged to hold onto losing positions.

An additional and useful layer of analysis is provided by Aulexo’s Maximum Uplift measure, namely, the inverse of the maximum drawdown. The median for most strategies was between 5% and 9% (Table 7), but the median of managed futures funds is over 13% and the top 25% (upper quartile) of funds in this strategy returned over 21%, which compares respectably with the worst 25% (lower quartile) of managed futures funds having maximum drawdown in excess of 12%.

Overall, event driven, distressed debt, long/short equity and managed futures (Table 8) saw a considerable number of managers achieving higher maximum uplifts than the index (25%, 24%, 26% and 39%, respectively).


The Sharpe ratio, another traditional statistic used in comparing strategies, is a risk-adjusted performance measure. A considerable number of the total fund universe has a Sharpe ratio less than that of the S&P 500. By contrast, almost half (48.9%) of the relative value funds (Fig.7 and Table 9) were likely to have registered a Sharpe in excess of the S&P 500, with many funds well beyond the S&P 500’s Sharpe ratio of 1.5, and similarly, fixed income funds were not far behind. This reflects the fact that while returns for relative value (and fixed income) funds were not as good as, say, managed futures, their volatility was notably lower. Historical VaR analysis again (Fig.8) finds managed futures well outside the overall trend for the industry in 2014, with more than 70% of managed futures funds (Table 10) having an expected VaR larger than the S&P 500’s 3.1%. We noted that there was a probability inexcess of 84% that a given managed futures fund would have a historical (95%) VaR greater than 2%, and a probability in excess of 45% of a VaR greater than 5%. Several strategies had a high likelihood of funds with VaR greater than 2%, with only relative value, fixed income and arbitrage funds maintaining a relatively low probability (45%, 31% and 49% respectively) of their funds having a VaR greater than 2%.


Investors’ concern about a strategy’s correlation to a major benchmark like the S&P 500 is always a valid consideration. Fig.9 demonstrates a considerable proportion of the universe of funds was weakly positively correlated with the S&P500, with a correlation co-efficient between zero and 0.5. Very few strategies saw a high degree of negative correlation with the index, apart from relative value where 65% of funds (Table 11) had a negative correlation less than -0.5. Distressed debt, long/short equities and managed futures saw over half of funds with a correlation co-efficient greater than 0.5.


Conclusion
When researching hedge fund performance for 2014, or any year, it is critical that investors and managers ensure they are employing multiple levels of data analysis, rather than relying on a single number to inform decision making. If using a benchmark, particularly one composed of investment managers, it is important to take into consideration the population and distribution of the constituents of that benchmark.
Our report card for the hedge fund industry is a positive one: there were no disaster strategies that suffered badly in 2014 and while, when measured against the S&P 500, most managers failed to beat equity returns, they did achieve what they set out to do. Not a single strategy had a negative mean or median return. Multi-strategy funds were probably the best at balancing of returns and risk, while fixed income appears to represent the safest sub-strategy.
However, managed futures funds were most likely to beat the S&P 500. Relative value funds appear to have suffered most in 2014, with both the highest likelihood of making a loss, and failing to beat the index.
By taking a holistic approach and analysing each strategy in the context of the distribution of the funds that compose that strategy compared to more common industry barometers, we have gone some way to demonstrate the more exotic dispersal of results underlying a simple performance benchmark for a given strategy. In future issues we will be looking more closely at these and other results to provide more cogent analysis of the composition of the hedge fund universe.
You can see how your fund’s 2014 performance compares by visiting www.aulexo.com/thfj
- Explore Categories
- Commentary
- Event
- Manager Writes
- Opinion
- Profile
- Research
- Sponsored Statement
- Technical