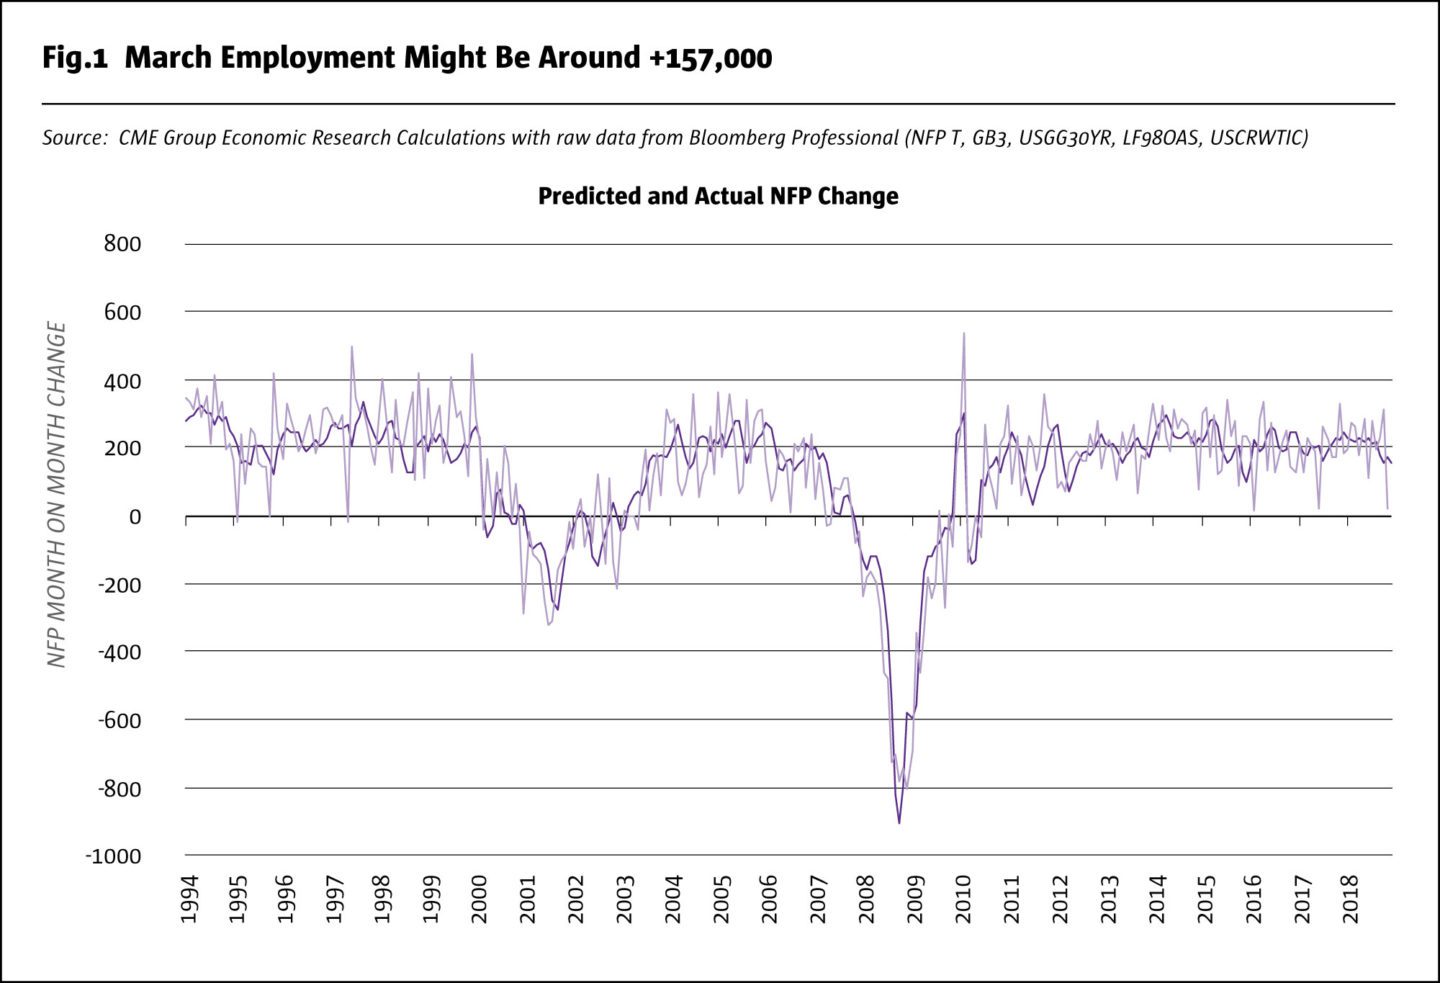
The past two employment reports took markets on a wild ride, with 311,000 jobs created in January but only 20,000 in February. If you average the two, however, US employers have been creating about 165,000 jobs per month so far in 2019, which is close to what our model suggests is the most likely outcome for the March employment report due out on April 5: +157,000 jobs. It may sound unusual to forecast the March jobs number this early. The month is not even half over, and no consensus estimate has yet formed. Therein lies the beauty of our simple three (and a half) factor model of non-farm payroll (NFP) monthly job gains and losses: using just three market-based factors whose data isn’t even especially recent, it explains nearly 75% of the month-to-month variation in NFP – better than the consensus estimate itself.
What labor market participants should be really worried about isn’t merely a flattening of the yield curve: it’s that a flattening of the yield curve could result in an eventual widening of credit spreads.
What’s more interesting than our model’s estimate of March job gains is what it says about how employment will evolve during the rest of 2019 and 2020 and why. The model suggests that US employment gains will gradually slow as a result of the Fed’s recent tightening cycle – and that relatively optimistic scenario assumes that credit spreads stay close to where they are currently. If credit spreads widen too much, US job creation could find itself in negative territory.
The models three major factors are:
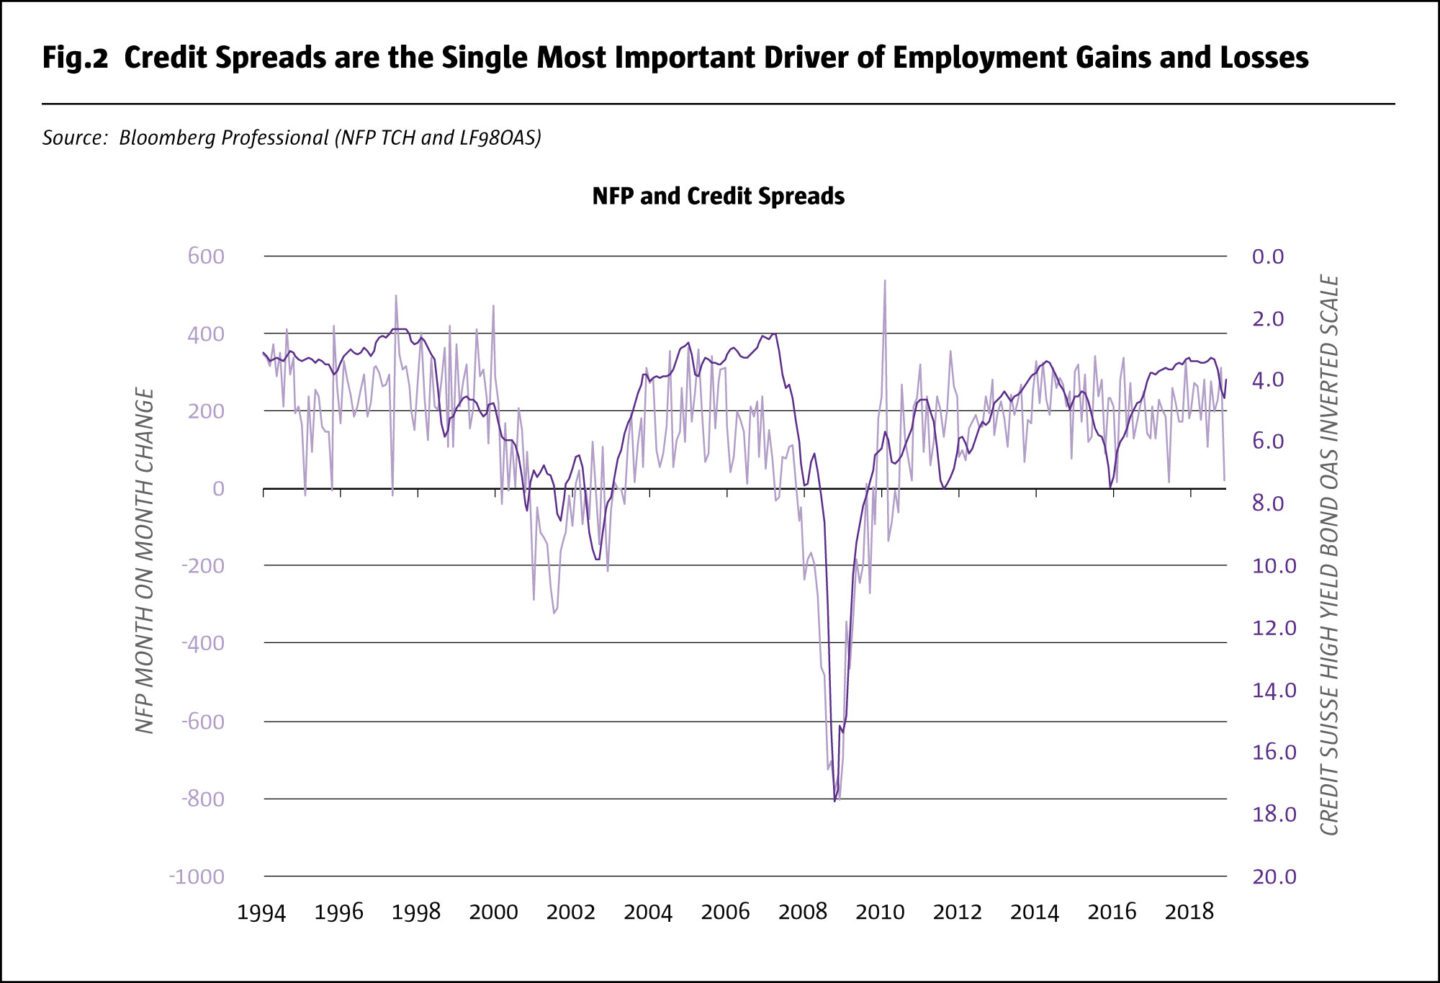
- Credit spreads: the option-adjusted spread (OAS) of the Credit Suisse High Yield Index over US Treasuries of comparable maturity. We average the data over two months and lag it one month. For the March forecast, we use the average of January and February OAS, allowing us to forecast employment growth a month in advance. This is far and away that most important factor in the model. It alone explains over half of the month-to-month variation in employment and has a t-statistic of -22 with a p-value of close to zero (Fig. 2). For every 1% widening of credit spreads, employment growth could slow by around 60,000-70,000 jobs on average per month.
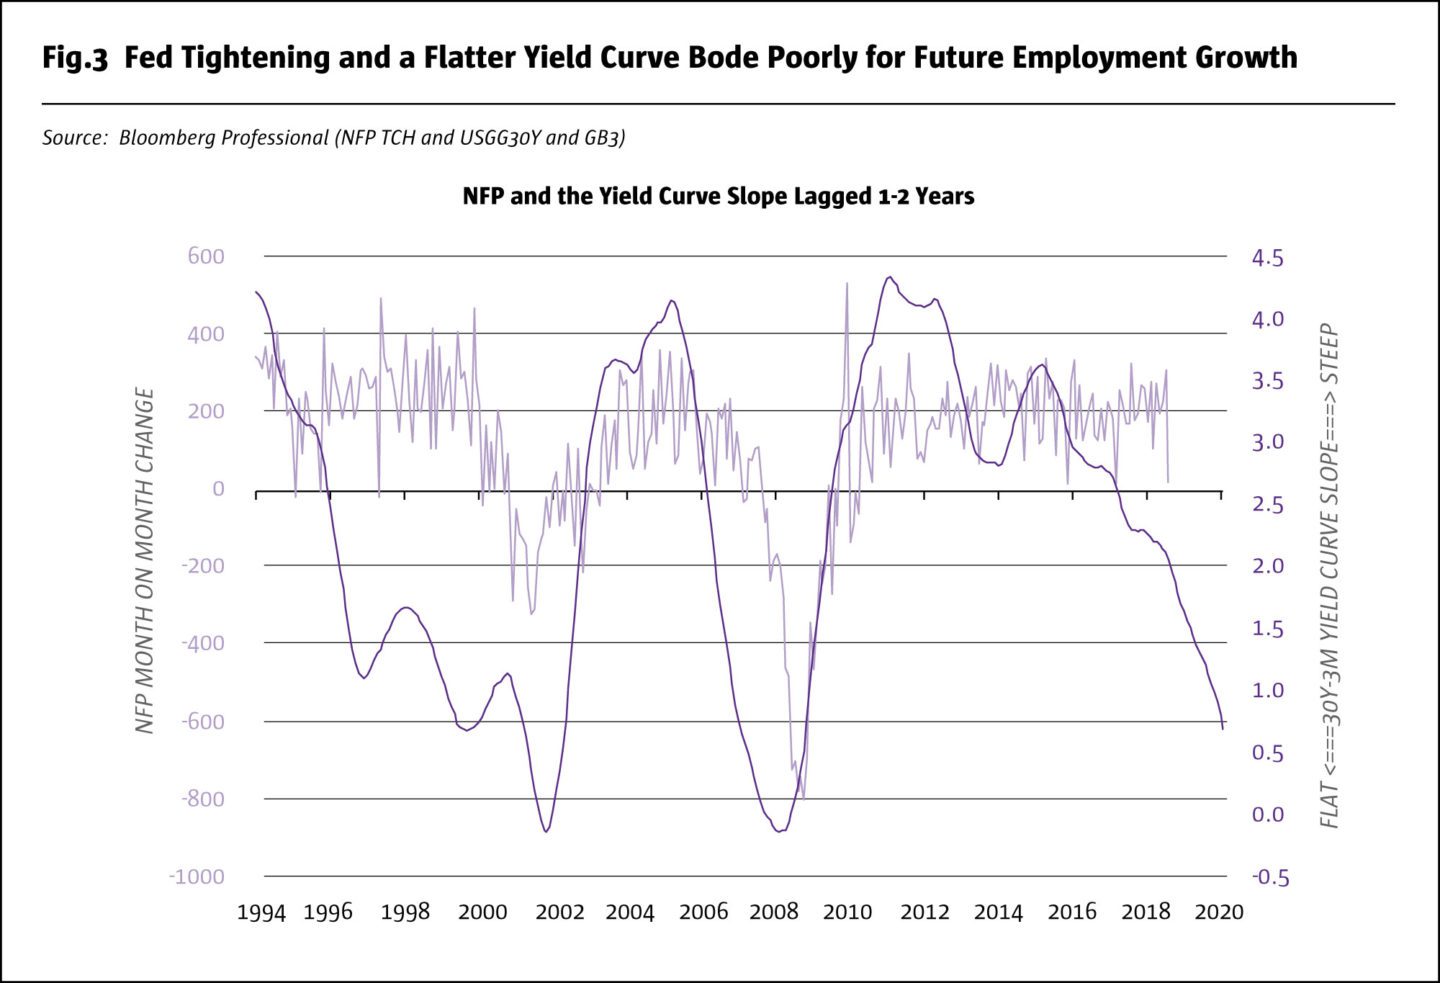
- The yield curve: here we use the difference between 30Y Treasury yields and 3M T-Bill yields. We average the yield curve over one year and lag it by one year, assuming Federal Reserve (Fed) monetary policy influences job creation with a long and somewhat variable lag of one to two years. As such, for March 2019, we are using the average level of the 30Y-3M spread for the period from April 2017 to March 2018. This was a period when the average yield curve steepness was around 175 basis points (bps) – far steeper than the current level about 60bps difference. The 115bps flattening that we experienced over the past year should slow employment growth by about 40,000 jobs per month by this time next year (Fig.4).
- Oil prices: rising oil prices aren’t typically positive for employment growth. True, the US energy industry has grown remarkably because of the shale oil revolution, but fracking creates relatively few jobs with highly concentrated economic gains or losses. By contrast, every consumer and business in America pays for oil either directly or indirectly. Despite the oil markets recent gyrations, oil prices aren’t too far from their recent average levels and probably will neither contribute nor detract much from job creation in coming months. When oil prices crashed in 2014-16, they provoked a widening of credit spreads, which was bad for job creation, but the fact of lower oil prices significantly cushioned the blow and the economy escaped with a slowdown in job growth and not an outright downturn. With the next widening of credit spreads, we might not be so lucky. In 2008, wider credit spreads and soaring oil prices conspired to tip the economy into a recession.
The remainder of the model is the residuals of the three previous month’s forecasts and a dummy variable to help explain exceptional job gains and losses during the decennial census hiring and layoff periods. That factor comes into play next in the spring and summer of 2020.
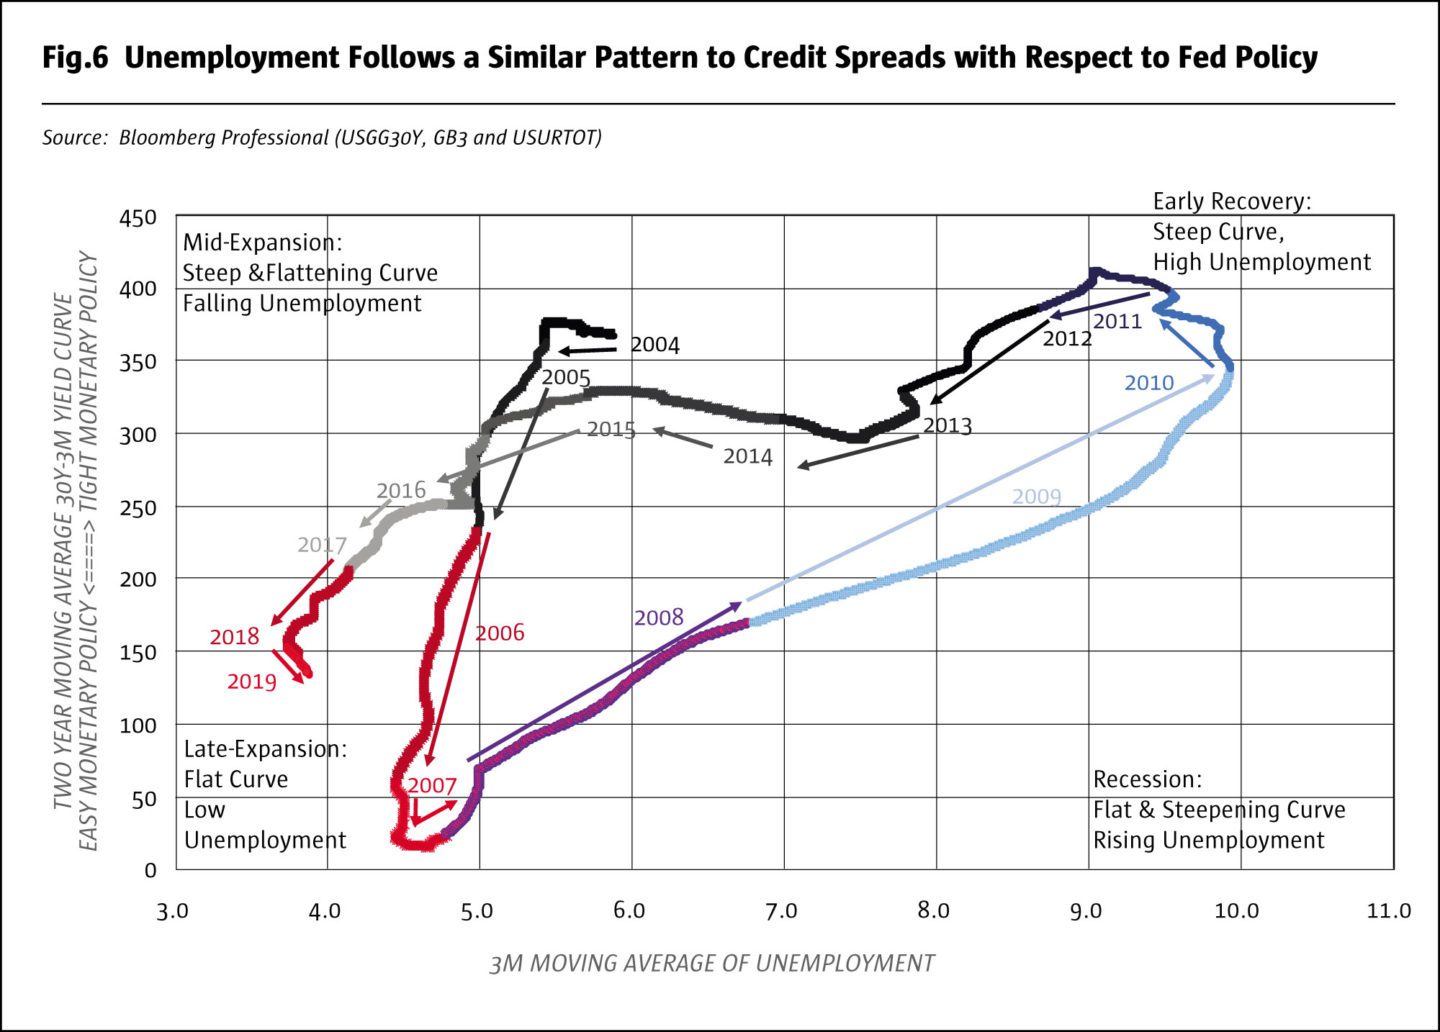
What labor market participants should be really worried about isn’t merely a flattening of the yield curve: it’s that a flattening of the yield curve could result in an eventual widening of credit spreads. That’s what happened during the 1990s and during the 2006-2008 period. In fact, credit spreads and employment both follow the same repetitive cycle with the yield curve.
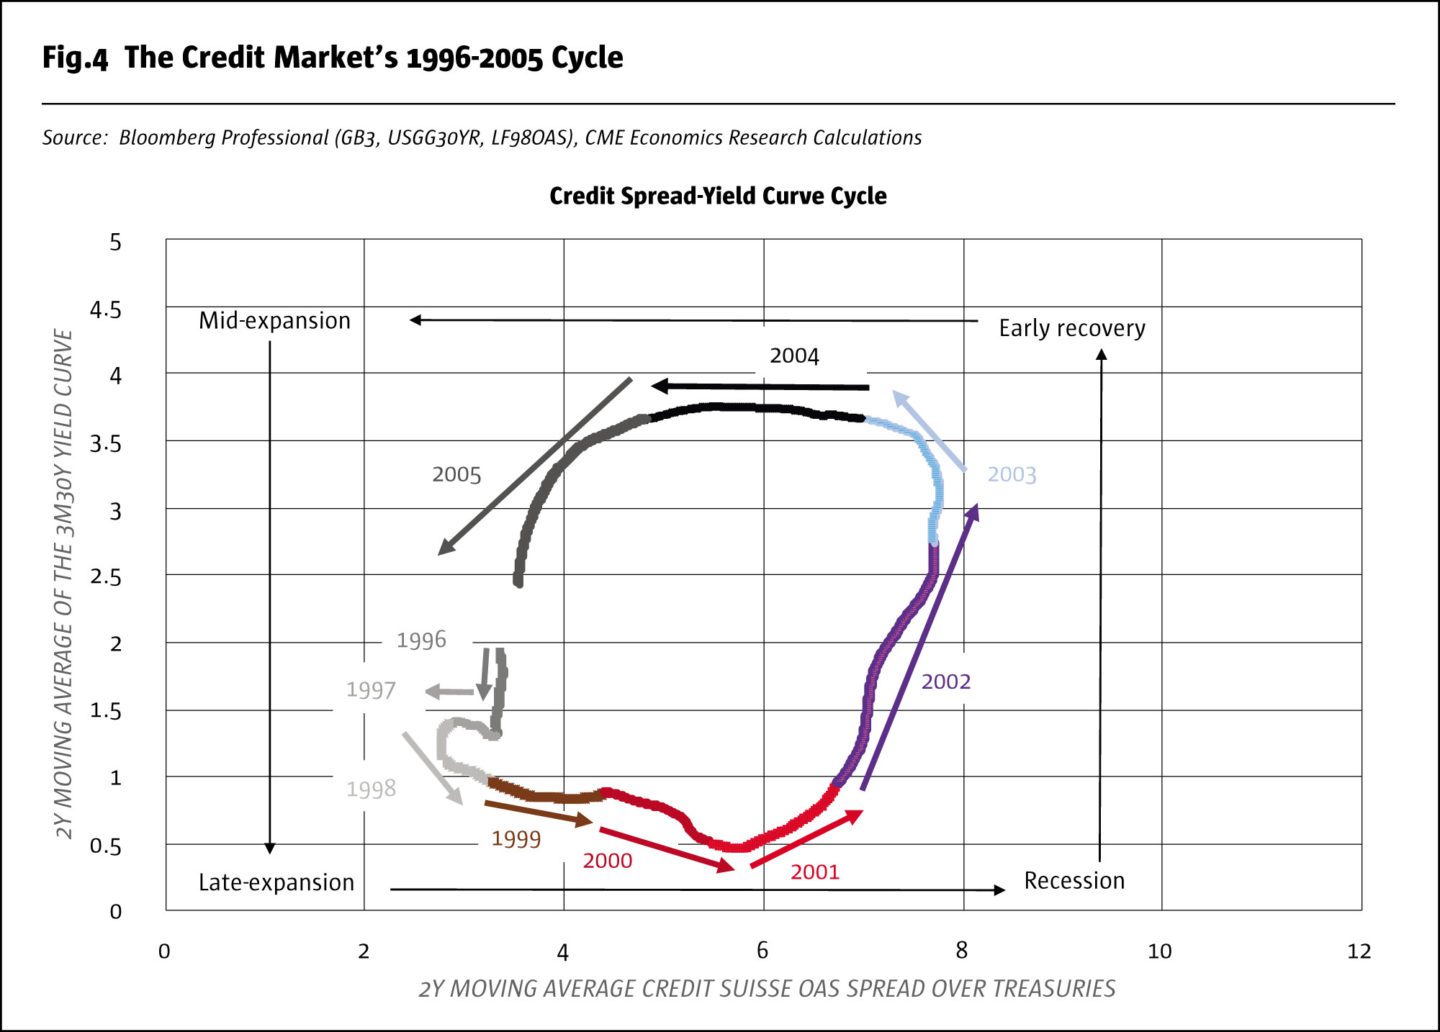
Unlike our model, which assumes that month-to-month changes in non-farm payrolls are a function of past credit spreads, yield curve shapes and movements in oil prices, the credit-unemployment-yield curve relationship is exactly that: a relationship and not a function. In mathematics, functions are not allowed to bend back on themselves, crossing the same territory twice. While functions are undeniably useful, they can also limit analysis as to what the true relationship between variables is, especially if that relationship involves cycles and feedback loops. When it comes to Fed policy, credit spreads and employment markets, they are all functions of one another and they are locked in a cyclical feedback loop that goes like this:
- Recession: after a period of flat yield curves, credit spreads widen, and unemployment begins to rise. Rising unemployment and seized up credit markets force the central bank to ease policy, steepening the yield curve.
- Early-stage recovery: easy monetary policy manifests itself through a steep yield curve, which in turn, begins to narrow credit spreads and ease unemployment.
- Mid-stage recovery: with unemployment falling and credit spreads narrow, the central bank concludes that it’s safe to raise rates (and that it needs to raise them to avoid inflation). As unemployment and credit spreads remain low, the central bank begins tightening policy.
- Late-stage expansion: unemployment stops falling and credit spreads stop narrowing amid an increasingly flat yield curve. Eventually credit spreads begin to widen and employment growth slows. The cycle begins anew (Figs.5-6).
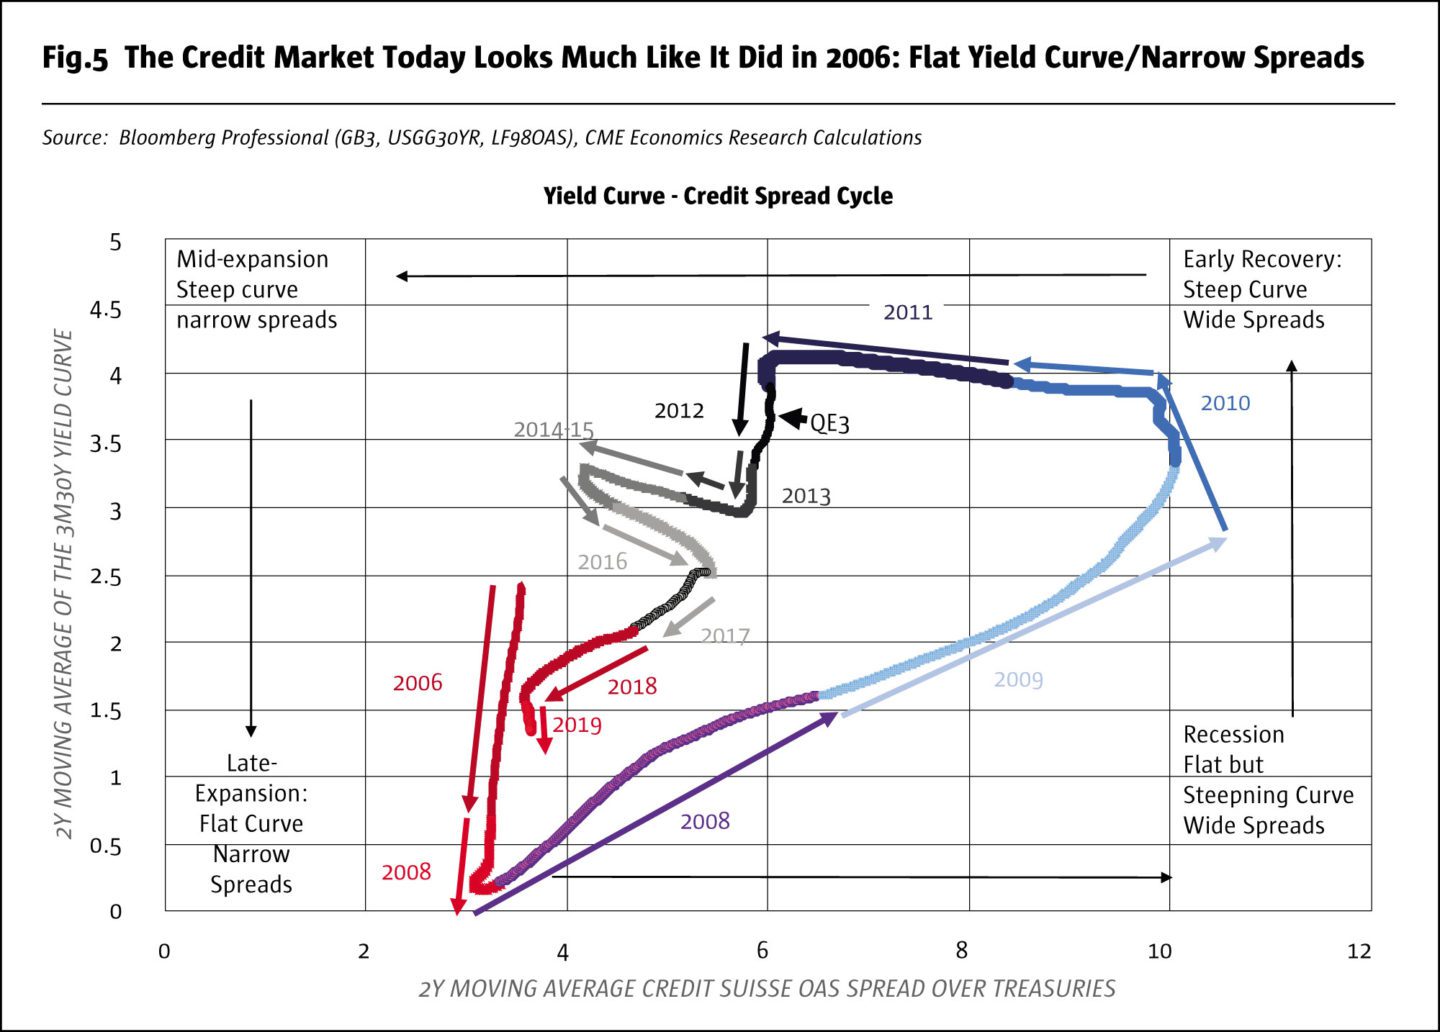
As of early 2019, it’s possible that we are already past the narrowest point for credit spreads. If so, that could be bad news for employment creation. If the Fed’s tight monetary policy (which they assume to be “neutral”), provokes a widening of credit spreads, the economy could quickly find itself with negative net job creation numbers. By our calculations, even just a 2% widening of high yield bond spreads over Treasuries from 4-6% could be enough to put job creation close to zero. In 2015 a credit spread widening of greater magnitude was absorbed by collapsing oil prices and an exceptionally steep yield curve. Oil prices aren’t guaranteed to offset wider credit spreads again and a steeper yield curve isn’t in the works unless the Fed rapidly cuts interest rates. In fact, only Fed easing can really derail the cycle that threatens to send credit spreads and unemployment spiraling higher if monetary policy were to remain too tight for too long.
Bottom Line
- Our model explains over 70% of month-to-month changes in NFP and can forecast it over one month in advance.
- Tight Fed policy and a flatter yield curve threatens to slow employment growth over the course of 2019 and 2020.
- As the yield curve flattens, the risks of an explosion in credit spreads and a sharp drop in job creation are increasing, especially towards 2020 and 2021.
- For March 2019, we expect around 157,000 jobs to be created.
All examples in this report are hypothetical interpretations of situations and are used for explanation purposes only. The views in this report reflect solely those of the authors and not necessarily those of CME Group or its affiliated institutions. This report and the information herein should not be considered investment advice or the results of actual market experience.
- Explore Categories
- Commentary
- Event
- Manager Writes
- Opinion
- Profile
- Research
- Sponsored Statement
- Technical
Commentary
Issue 139
Sneak Peek into Jobs Report Due April 5 and Beyond
What will happen to US employment gains
Erik Norland, Senior Economist, CME Group
Originally published in the February | March 2019 issue