Most investors, whether institutional or individual, tend to believe that stocks are a good—perhaps even the best—investment in the long run. However, the reason for expecting good performance from stocks is perhaps not always clearly articulated: Quite simply, it is because they are risky.
The return–and risk–of stocks with bonds
This positive relationship between risk and expected return is quite intuitive. If you decided to lend money to the US Government or to your brother-in-law, would you charge them the same rate of interest? The latter proposition is clearly more risky, and a rational investor would expect to be compensated appropriately for bearing that additional risk. If the expected return on US Treasury bonds is 2%, for example, you may decide to charge your brother-in-law a 6% rate of interest (remember that this is the expected return at the time you make the loan: there is a chance your entire loan may not be repaid, which would reduce your realized return. That’s what risk implies: the possibility of getting less than you expected).
This logic can be extended to other investments. Let’s limit ourselves to stocks and bonds. [1] US Government debt is generally viewed as being risk-free, if we ignore inflation risk. A US investor would rank investment-grade senior corporate debt as slightly more risky than Treasury bonds, followed by subordinated debt, preferred stock, and common stock. The reason stocks are the riskiest is that they are at the bottom of the pecking order in terms of their claim on the company’s profit or cash flow. But the reason they can also be the most rewarding is that they are entitled to all residual profits, after paying off the other more senior claims in the corporate capital structure.
Historically, the performance of equities has varied widely over time and from country to country. Nevertheless, it would not be inaccurate to say that, over long enough periods (although it is not clear exactly how this should be defined), stocks have generally earned “reasonably good” returns. Modern Portfolio Theory (MPT), however, tells us that returns must be assessed relative to risk. While most of the widely-used metrics of risk are not perfect, the standard deviation of returns (often called volatility) and their maximum peak-to-trough drawdown(s) are generally considered fairly adequate risk proxies for most traditional asset classes.
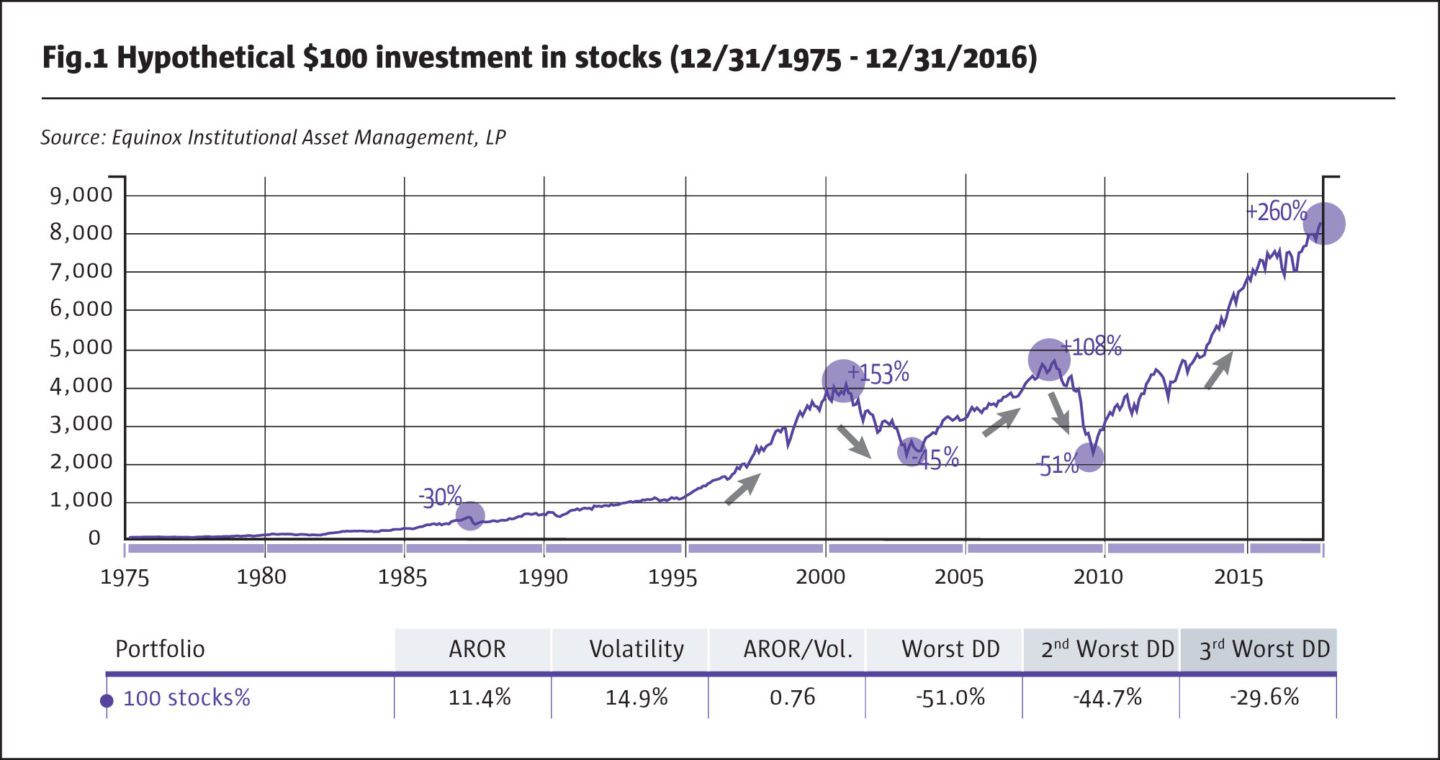
As shown in Fig.1, $100 invested in the S&P 500 Index on December 31, 1975 would have grown to more than $8,200 at the end of 2016. This represents a compounded annual return of 11.4%, and bolsters the case for stocks in the long run. Of course, the underlying assumption is that you stayed invested in the stock market throughout these 41 years.
There were at least a couple of times when some investors may not have had the fortitude to do so. Consider what happened in August 2000, after the four year bull market during which investors earned a cumulative return of about 150%. The dot-com bust saw the market drop by −45%, wiping out almost the entire gain. Investors who stayed in experienced another bull run of more than 100% and recouped all their losses. That was followed by the worst drawdown in recent history, as the market fell by more than −50% and once again wiped out the entire recent gain. [2] Overall, in the twelve years from 1997 to 2008, stock market investors would have barely broken even!
At the time this is written, the market is up more than 250% from its low in early 2009, and some investors are becoming increasingly nervous.
Stocks have clearly been very risky, especially during the last two decades. Whether the returns investors earned were adequate compensation for bearing that risk is a difficult question to answer, even with the benefit of hindsight. The specific historical time-period used in the analysis clearly influences the results dramatically. Expected returns are notoriously difficult to forecast, whereas risk appears to be relatively more stable and somewhat predictable. In this paper, we shall therefore try to focus on addressing the question of how equity risk can be managed or mitigated.
Diversifying stocks with bonds
It is quite clear that stocks have historically been volatile and have experienced sudden and sharp declines at times. Looking back today, we can say that they did in fact bounce back, although the timing and length of the recovery period were both uncertain and unpredictable. Unfortunately, many investors have been known to display a lack of tolerance for the pain, and have tended to bail out during downturns, often close to the bottom, thereby forgoing the benefits of the eventual recovery. [3] Psychologically, it has been shown that a 20% loss of wealth, say, causes individual investors much more pain than the pleasure provided by a 20% gain. Professional and institutional investors often face the additional risk of being fired when performance is negative, even though it may be market-driven rather than a reflection on their abilities.
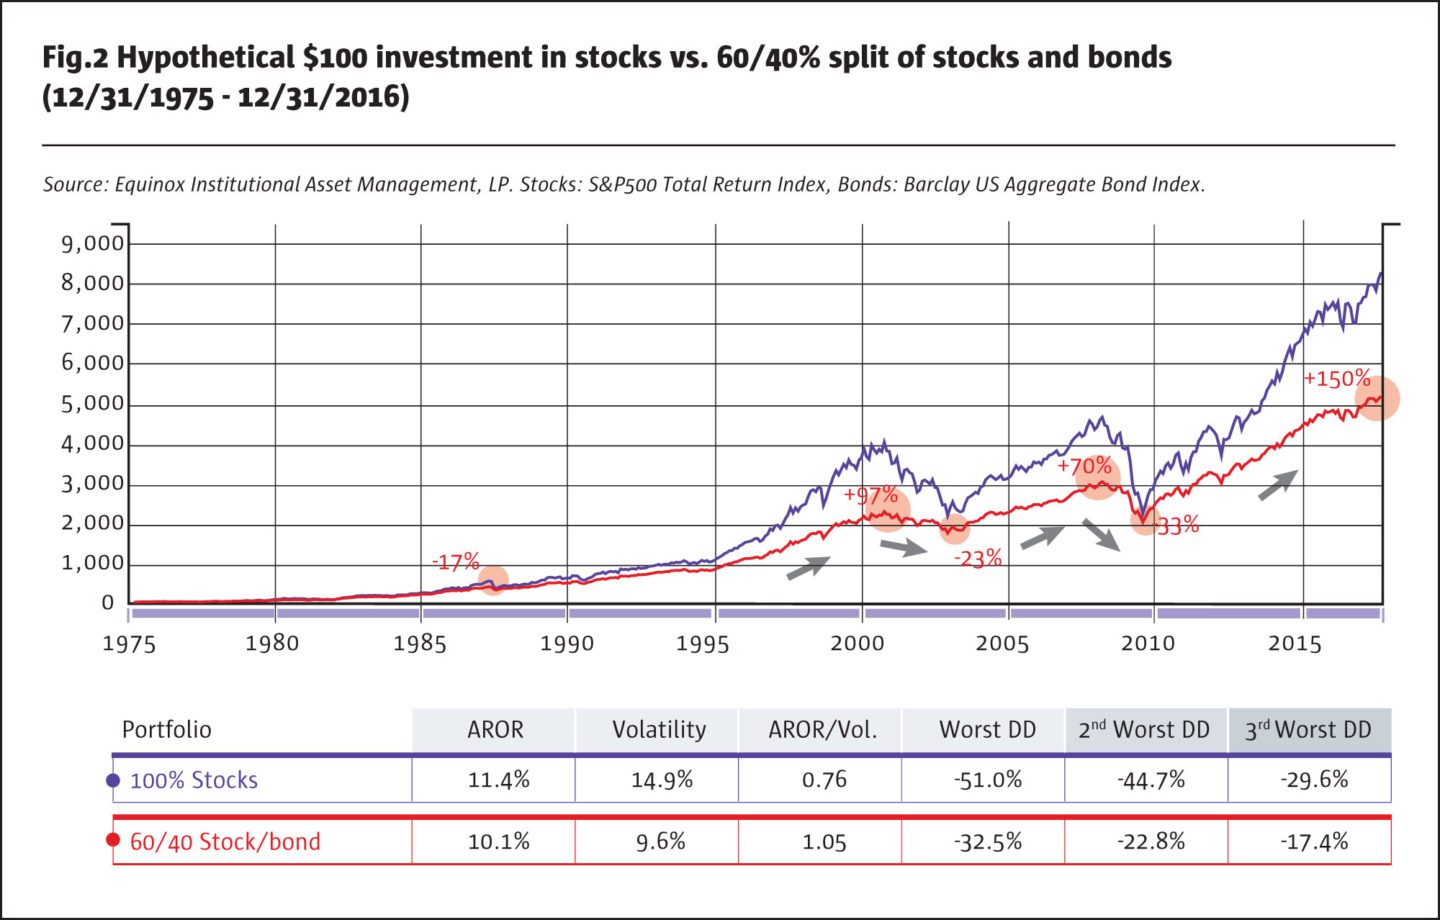
A 60/40 stock/bond portfolio would have provided investors a much smoother ride than just stocks: the peak-to-trough drawdowns were significantly lower, as were the run-ups. As bonds had lower returns than stocks, the average return on the stock/bond portfolio was lower. However, this was more than offset by the lower risk or volatility, resulting in a more attractive reward/risk ratio. In addition, the smoother ride could have been helpful in persuading investors to stay put during market downturns, and thus to benefit from the eventual recovery. A 60/40 stock/bond portfolio has been the “gold standard” for almost half a century now. It was in the 1960s that pension funds and other institutions began implementing some of the recommendations of MPT, and the 60/40 portfolio was born. It is useful at this point to consider how this portfolio compares to other possibilities. The graph below shows combinations of stocks and bonds, ranging from 0/100 (i.e., all bonds) to 100/0 (all stocks), using the average annualized returns from the same historical period as before.
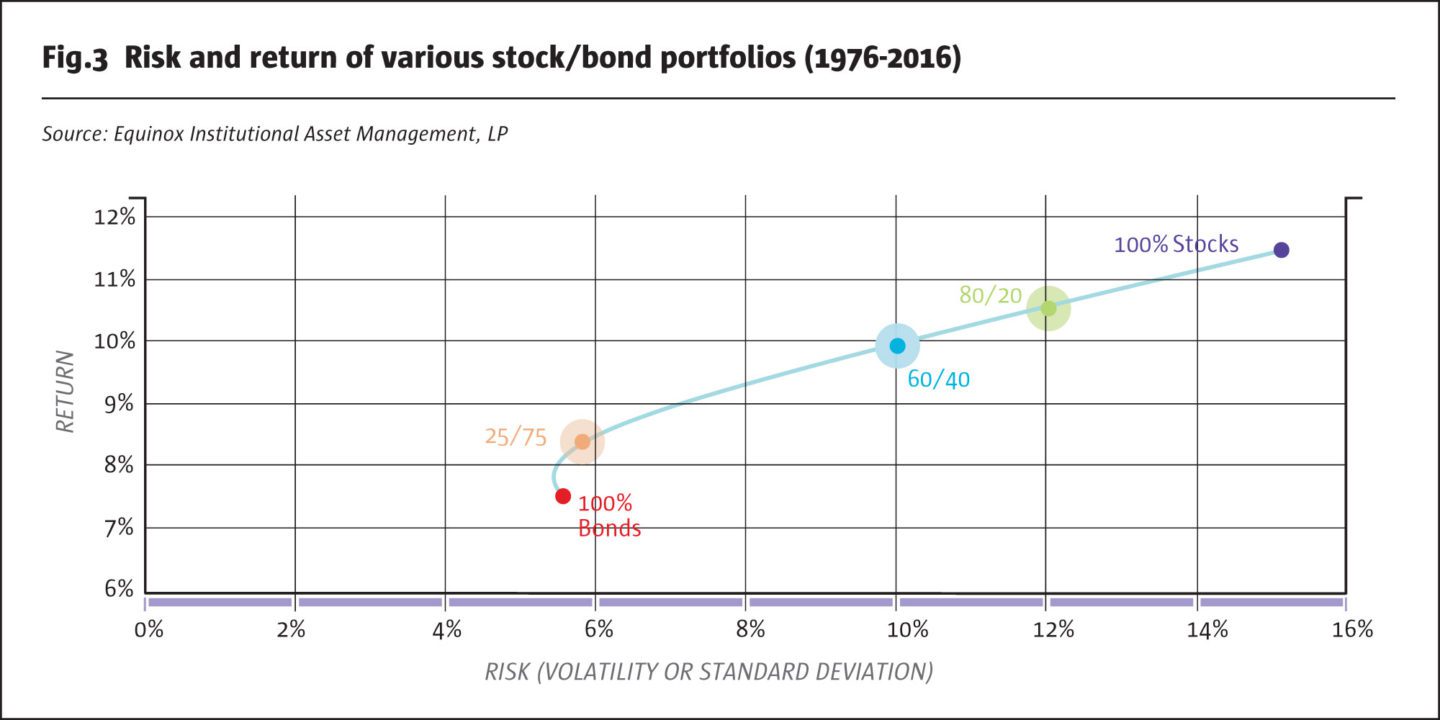
Using this tool, investors can decide which portfolio they might want to hold based on their risk preference. Conventional wisdom suggests that younger investors, who can generally afford to take more risks, mainly because they have a longer investment horizon, would prefer portfolios such as 80/20, with 12% risk and about 10.5% return. Older or more risk-averse investors might choose to hold a 25/75 portfolio, which has 6% risk and 8.5% return. Of course, the “ideal” portfolio will evolve over time as an investor’s risk preferences or financial circumstances change.
Diversifying stocks and bonds with alternatives
Even though the 60/40 portfolio described above provided a smoother ride than an all-stock portfolio, it still lost about −32% during the Global Financial Crisis of 2008. Stocks and bonds are the two most widely known asset classes and cover a lot of ground: stocks range from US and developed markets to emerging markets, from small cap to large cap, and from growth to value; bonds range from sovereign debt, including developed and emerging markets, to corporate bonds, which run the gamut from investment-grade to high yield; and finally, there are the “hybrid” categories, which include convertible bonds and preferred stocks. Despite this wide array, the fact remains that returns on stock-bond portfolios are driven by a very small number of economic factors: basically, interest rate risk, credit risk, and equity market risk (which, of course, subsumes several micro- and macro-economic risk factors). In fact, the equity market is by far the biggest contributor to the overall risk of any stock/bond portfolio. A 60/40 stock/bond portfolio derives more than 90% of its risk from stocks, even though only 60% of its capital is allocated to this asset class. [4]
This is where MPT comes in handy once again. It turns out that there are a number of other asset classes or investment strategies that are different enough from stocks and bonds to potentially provide additional diversification and an even smoother ride than a stock/bond portfolio. Collectively termed “alternative investments,” these typically include some entirely new asset classes such as real estate, commodities, and collectibles. Certain trading strategies, which are more complex than simply buying and holding stocks and bonds (involving, for example, shortselling, arbitrage, relative-value investing, etc.) and which are generally classified as “hedge fund strategies,” also fall into this category. The common property of these alternative investments is that they tend to have low correlations to both stocks and bonds. Adding them to a stock/bond portfolio, therefore, potentially provides incremental benefits.
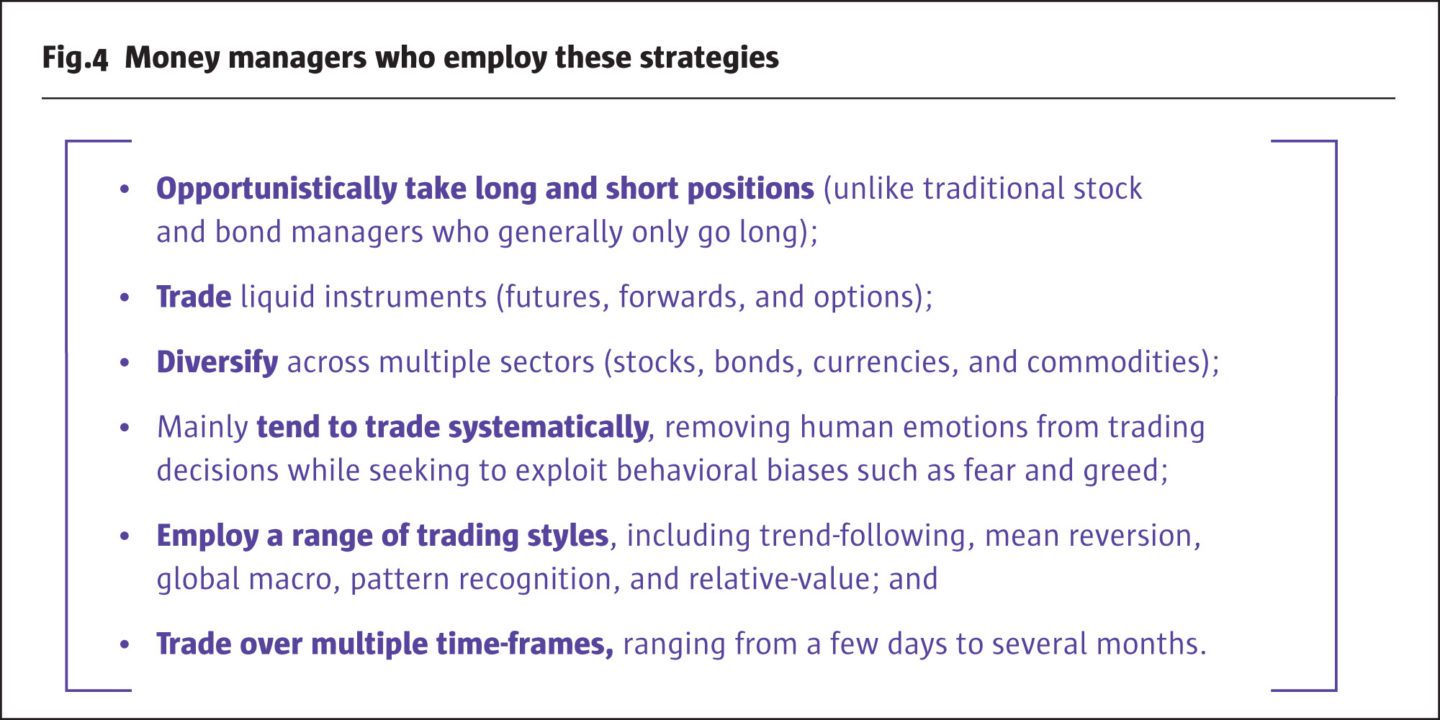
As the Global Financial Crisis rudely reminded us, even some of these alternative strategies may not hold up well during a widespread market meltdown. Although low during more normal market conditions, their correlations to stocks may increase during crisis periods, thus failing to cushion the blow when most needed. In our view, one of the few strategies that behaved quite differently (although that does not necessarily imply anything about how it might perform during a future crisis, should one occur) and that has also stood the test of time in terms of providing reasonably good risk-adjusted returns over multiple market cycles is “managed futures.” What is included in this bucket, what the potential benefits are, and from where they stem has been discussed extensively elsewhere, but a very brief overview may be helpful here. [5]
The end result is that these return streams tend to be uncorrelated to stock and bond returns over multiple market cycles and can potentially provide greater diversification and a smoother ride for investors. This is illustrated in the graph on page six, where we show the returns on a stock/bond portfolio that starts out as 60/40, but then allocates 20% to “managed futures,” i.e., a 48/32/20 stock/bond/managed futures portfolio. We use the BTOP50 Index as a proxy for managed futures strategies; but more on this later.
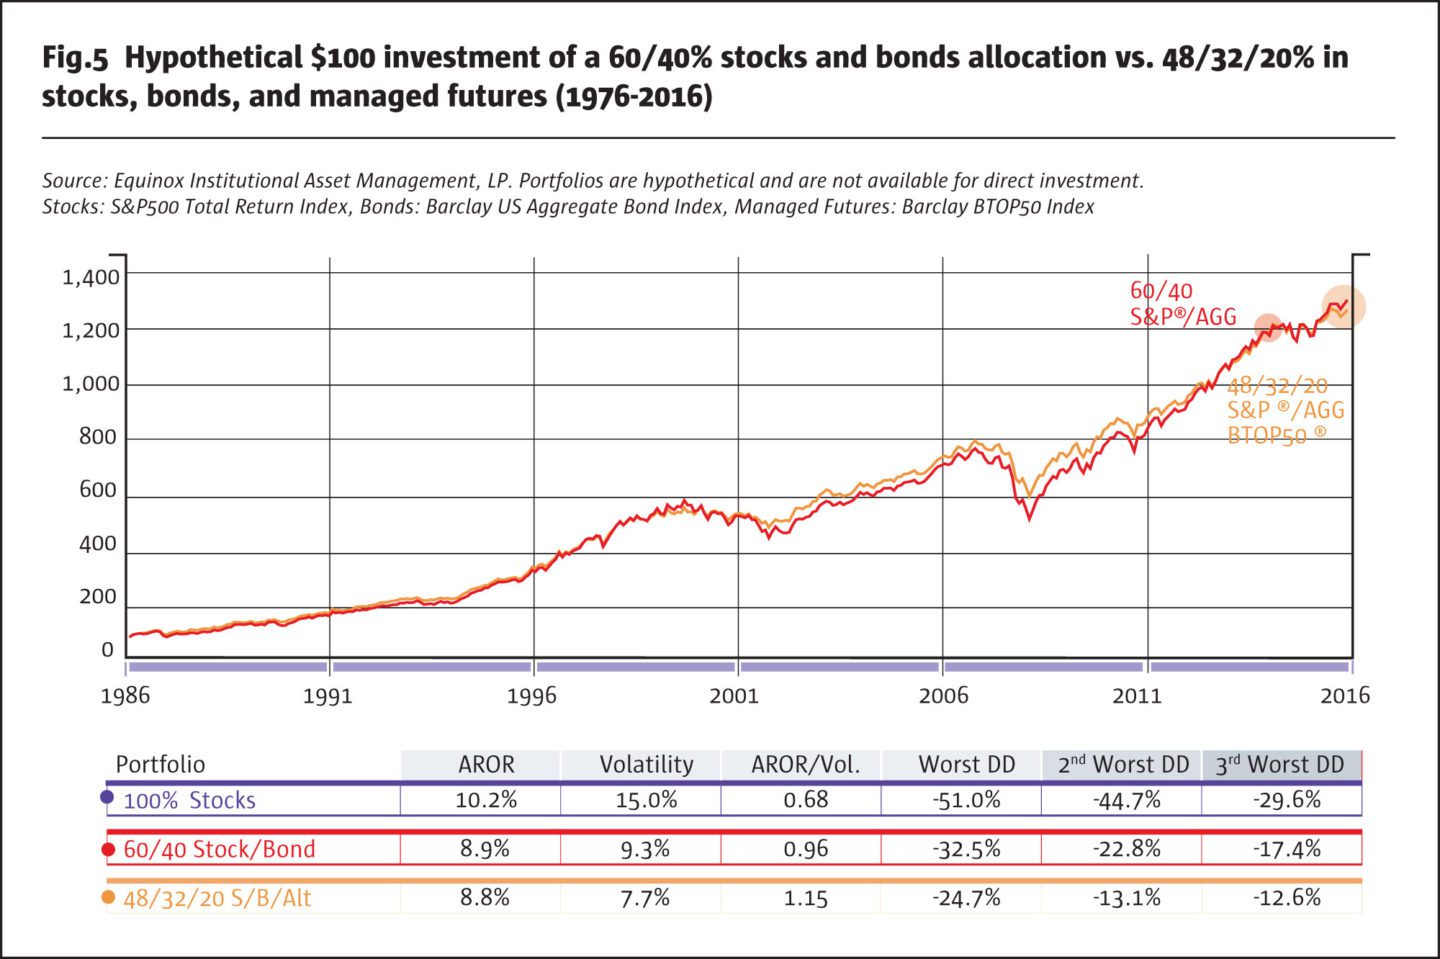
Note that the time period is now shorter (29 years) than in the previous graphs (41 years), because data for the BTOP50 Index is only available since 1987.
The new portfolio is an improvement over the 60/40 stock/bond portfolio. While the return is almost the same, the risk is quite a bit lower. The drawdowns are about two-thirds as deep, and the reward/risk ratio is quite a bit higher. Of course, the improvement relative to the all-stock portfolio is even more dramatic. The logical question, then, is why one should restrict the alternatives allocation to only 20%. How would a portfolio with 50% allocated to alternatives perform? The answer is provided in Fig.6.
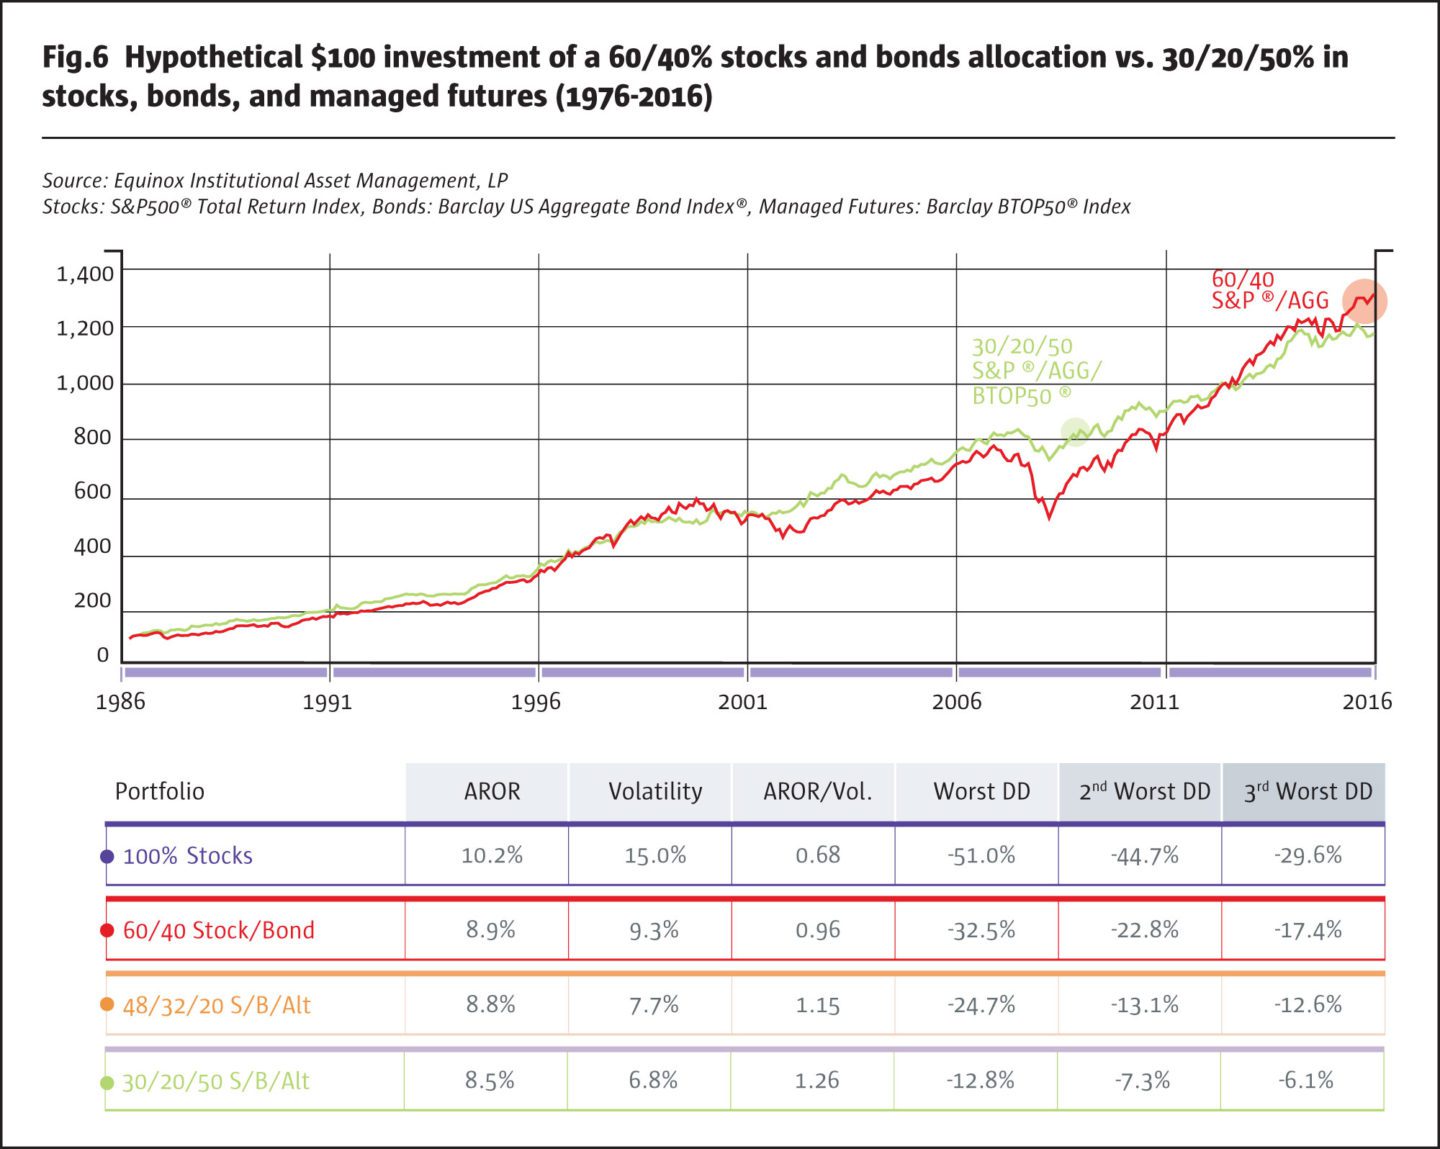
The new portfolio with 50% allocated to alternatives handily outperforms the three previous portfolios on all metrics. The worst drawdown is about half as deep as that of the 48/32/20 portfolio, and about one-fourth as deep as the worst drawdown the all-stock portfolio experienced. Relative to stocks, volatility has been cut in half, without sacrificing much return: the reward/risk ratio is almost double. Equity markets contribute a much smaller part of overall portfolio risk now.
As we discussed earlier, 60/40 stock/bond portfolios have been used widely as benchmarks. We have looked at the effects of reallocating a portion of this portfolio to alternative investments, but it is neither necessary nor correct to restrict ourselves to 60/40 (or proportionally adjusted) allocations to stocks and bonds. The graph below shows what is known in MPT as the “efficient frontier:” portfolios of stocks, bonds and alternatives that, for any given level of risk, maximize the level of return. Interestingly, the 48/32/20 portfolio lies in the interior of the graph and is not efficient, while the 30/20/50 portfolio is very close to the efficient frontier. There is a whole range of portfolios on the efficient frontier that dominate the 48/32/20 portfolio. These efficient portfolios have either the same or higher return with lower risk, or the same or lower risk with a higher return. They range from (approximately) 30/20/50 to 37/10/53, as shown in the graph.
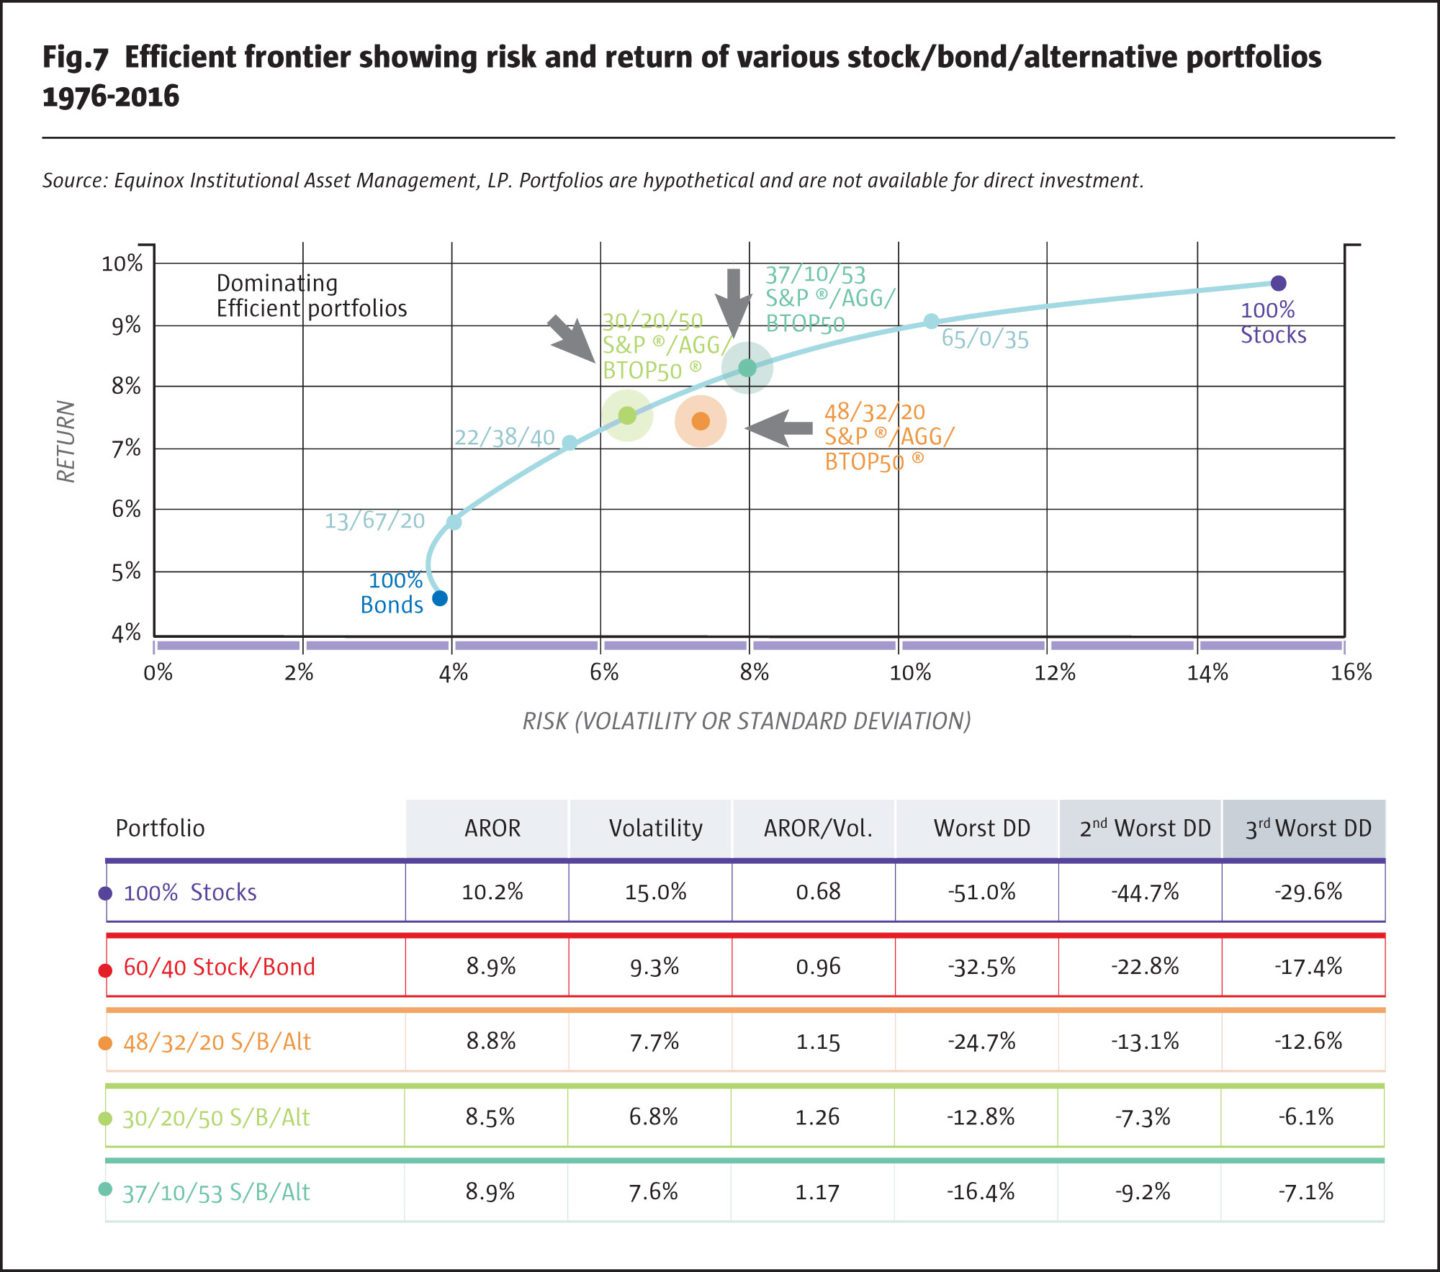
The 30/20/50 portfolio handily outperforms the three previous ones we have looked at. More generally, most portfolios with say 40% to 55% allocated to alternatives tend to dominate those that have much smaller alternative allocations. Let us examine the implications of this finding, and see how it can be extended to potentially provide even greater potential benefits.
The reasons for under-diversification
In the real world, it is extremely rare to find investment portfolios with allocations as high as 50% to alternative strategies. Most portfolios continue to be significantly under-diversified, and in most cases, the equity market continues to be their biggest source of risk, its contribution often exceeding 90%. In our opinion, the main reasons for this under-diversification are the lack of availability of diversifying strategies, and their opportunity costs, both real and perceived.
Lack of availability…
Until quite recently, many diversifying alternative strategies were unavailable to investors other than institutions or ultra-high-net-worth individuals. Some industry professionals have perceived these types of investments—which often involve short-selling, use leverage and/or derivatives, and trade illiquid assets—as being either too risky for “retail” investors, or too complex for them to understand fully, unlike investments in stocks and bonds. Hence, these strategies were often packaged or structured as “hedge funds,” which came with restrictions such as accredited investor status, lock-ups, periodic (rather than daily) redemptions with provision of advance notice, etc. Managers of these strategies expected to be paid for their skill in providing uncorrelated, absolute returns streams, and often charged fees such as “2 and 20.” Performance-based incentive fees, back in those days, were viewed as relatively difficult to accommodate in a mutual fund structure, and hence these alternative strategies generally remained out of reach for most individual investors. As a result, it was difficult for small investors to diversify meaningfully. Strategies such as real estate (via REITs) or commodities were utilized in small size, but mainly by larger investors. For about a decade now, many truly diversifying alternative strategies have been packaged into mutual fund structures, making them more widely available. However, as we shall discuss, this may not always be the most efficient way to utilize their benefits.
Opportunity costs
With few exceptions, even those investors who had access to “hedge fund strategies,” tended to allocate only small amounts to alternatives, so that the equity market remained the largest source of risk in their portfolios. Another reason that equity risk was not mitigated or diversified away was the fact the correlations of many of these investments to equities increased dramatically during market meltdowns (such as the Global Financial Crisis of 2008). Thus, investments intended to be diversifiers of equity risk ended up displaying equity-like performance at precisely the wrong times. As we have discussed elsewhere, managed futures were one of the very few strategies that held up well during the Crisis; even so, however, the size of the allocations to them was almost invariably too small to make a real difference. We have shown above that an allocation of 20% would have reduced the drawdown of a 60/40 portfolio from about −33% to −25%, an appreciable reduction. But allocations to managed futures typically range from 0% to perhaps 2-3%, hardly enough to make a meaningful difference.
It is worth noting that their stellar performance in 2008 led to greater interest in managed futures strategies, and saw more investors making allocations; in some cases, these were even slightly bigger than before, albeit nowhere close to 20%. As the stock market bounced off its early 2009 lows, and climbed by more than 250%, many investors proceeded to abandon alternatives because of the perceived opportunity cost of reducing their portfolio exposure to a raging equity bull market. This type of “rear-view mirror” driving—making portfolio decisions based on hindsight and short-term historical performance—is an insidious investor bias, which has led to several percentage points worth of underperformance by investor portfolios over multiple market cycles.
The power of “&”
Even without the benefit of hindsight discussed above, there is a real opportunity cost to investing in managed futures (or other diversifying) strategies. Consider an investor holding a $1 million dollar 60/40 stock/bond portfolio who decides to allocate 20% to managed futures strategies. Traditionally, the way to achieve this is to sell stocks and/or bonds and invest in a mutual fund (or other pooled vehicle) that accesses the managed futures trading strategies. The managed futures mutual fund, however, typically takes the $200,000 and holds most of it in the form of cash and cash equivalents, including short-maturity Treasury bills. A small part of the $200,000 (10% to 25%, say) is used as margin or collateral to access the managed futures trading program(s). Thus, a 60/40 stock/bond portfolio has now become effectively a 48/32/20 stock/ bond/cash portfolio, plus access to a diversifying return stream. If we believe that stocks and bonds in the long run have higher expected returns than cash (which they should because they are riskier), then the diversification has been achieved at a significant opportunity cost: exposure to stocks and bonds has been reduced by 20%. The decision has been framed—and implemented—as an “OR” decision: either you can be 20% exposed to stocks and bonds, OR you can be exposed 20% to cash and have 20% “notional exposure” to managed futures trading program(s). Clearly, this is inefficient, and the impact of the inefficiency increases with the size of the allocation to managed futures.
But does this really need to be an “OR” decision? We believe it does not; it can instead be structured as an “AND” proposition. Our proposed solution has a number of potential benefits over the traditional approach.
The “Ampersand” or “&” solution we propose is simple in theory: There is no need to sell stocks and bonds in order to access managed futures trading programs.
As these programs can typically be accessed by using anywhere from 10% to 25% margin or collateral, the stocks and/or bonds in the investor’s 60/40 portfolio can themselves be posted as collateral (likely with a small “haircut,” depending on the exact situation). [6] This is an “overlay” approach, where the alternatives are overlaid on top of the stock/bond portfolio without the need to sell any stocks or bonds. We will not go into details here about how exactly this would be implemented, as that would vary from case to case, but we will simply assure the reader that it can indeed be accomplished.
Using the power of “&,” an investor can continue to have 60/40% exposures to stocks and bonds, as well as 20% access to managed futures strategies. And there is no reason now to limit the “notional exposure” of these strategies to 20%. It is easily possible to increase this to as much as 50% to 75%, or even higher, thereby truly harnessing greater benefits of diversification as preached by MPT (“Notional trading level” or “notional exposure” is a somewhat tricky concept that we’ve discussed in detail elsewhere). [7] Another way of thinking about this is to realize that portfolio weights no longer need add up to 100%, but can be higher. Thus, a 60/40 portfolio that is 50% exposed to managed futures strategies is a 60/40/50 portfolio, with a 150% “exposure,” rather than being constrained to be a 30/20/50 stock/bond/cash portfolio with access to managed futures. Let us compare the performance of these two portfolios in Fig.8.
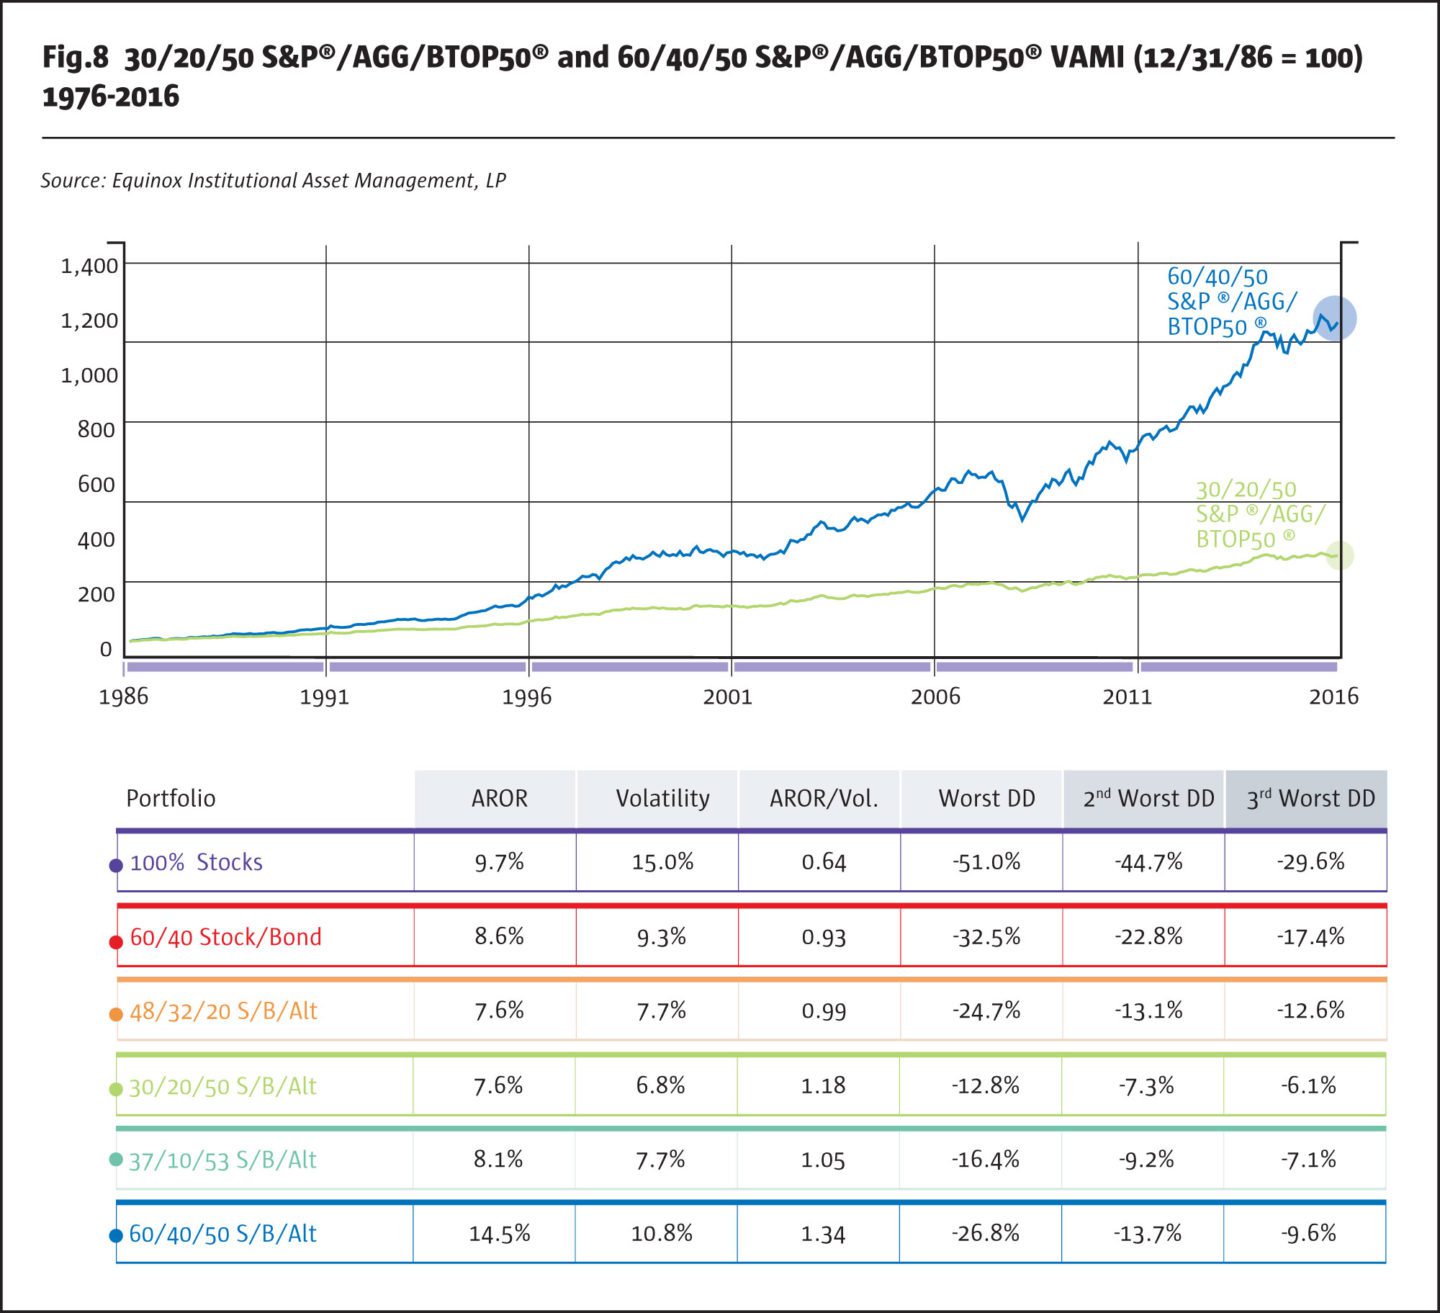
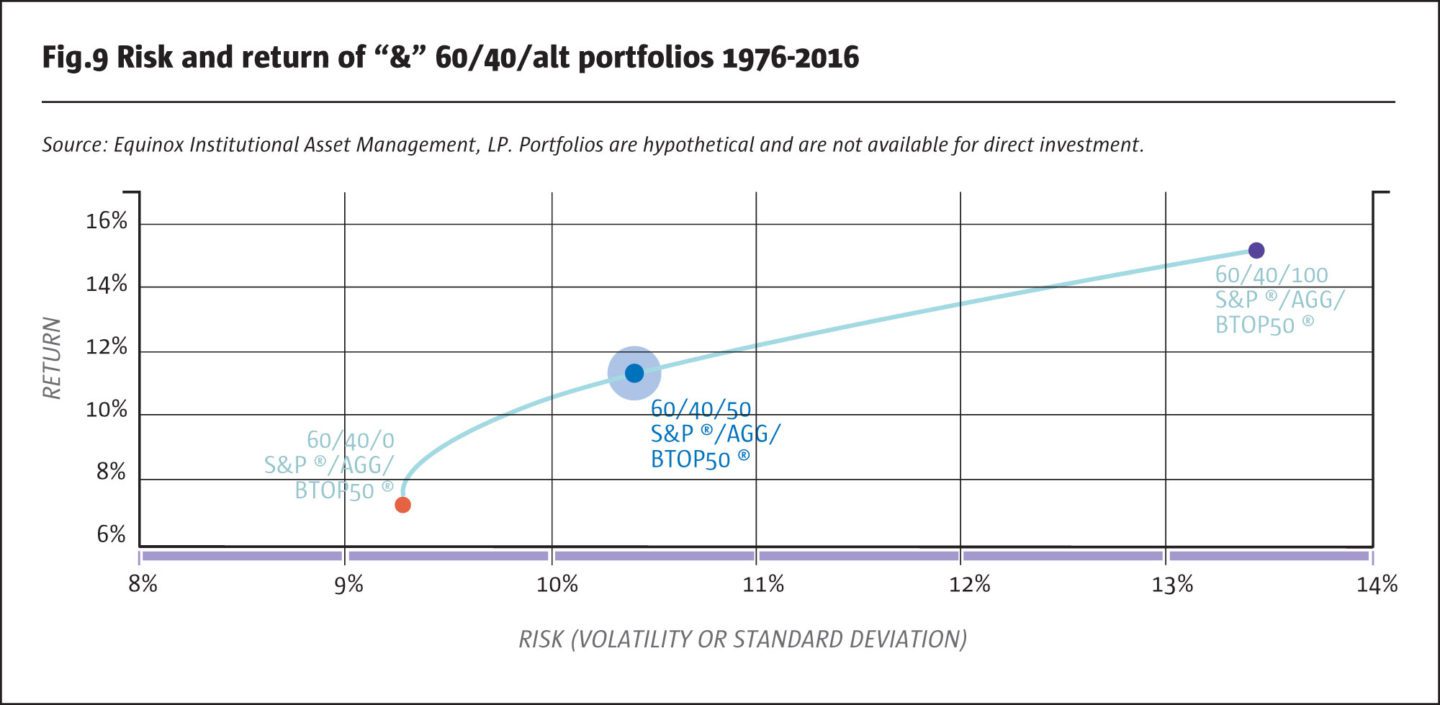
The 60/40/50 hypothetical “&” portfolio dominates both the all-stock and the 60/40 stock/bond portfolios: much higher return, higher reward/risk ratio, and shallower drawdowns. It is comparable to the 48/32/20 portfolio in terms of drawdowns, but has a significantly better reward/ risk ratio. And while its risk and drawdowns are higher than those of the 30/20/50 portfolio, its return, both absolute and risk-adjusted, is significantly higher, as the graph dramatically illustrates.
There is nothing sacrosanct about 50% exposure to managed futures: as MPT teaches, by varying the size of this allocation, the portfolio’s risk can be customized to suit an investor’s risk preference. The next graph shows the risk and return for various combinations using the “&” approach with the 60/40 stock/bond portfolio and an allocation to managed futures ranging from 0% to 100%. [8]
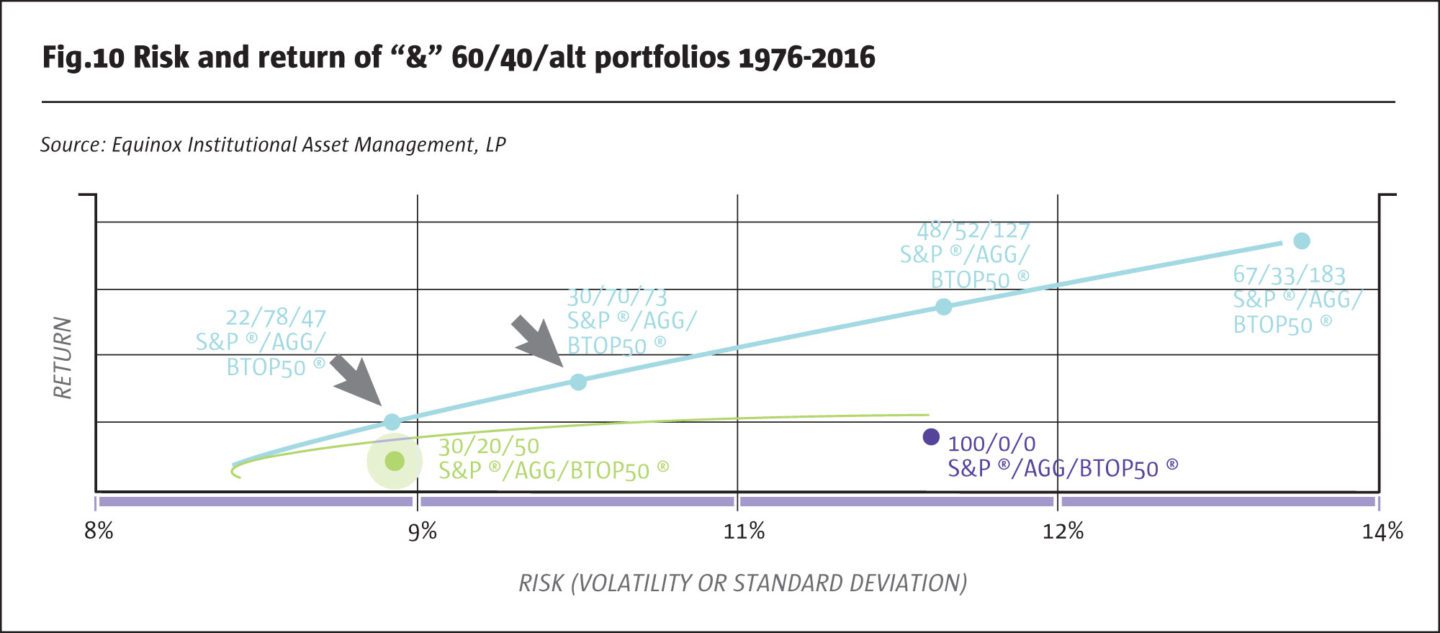
It is also not necessary to limit ourselves to a mix of stocks and bonds that is proportional to 60/40. The next graph shows an efficient frontier for various “&” combinations of stocks, bonds and managed futures. The allocation to stocks and bonds is not fixed at 60/40, but is simply constrained to add up to no more than 100%. [9] The managed futures exposure is obtained by using the stocks, bonds, and cash (if any) in the portfolio as collateral, as discussed earlier.
The dominance of the “&” portfolios over traditional portfolios (in which the allocation to stocks, bonds, cash, and managed futures adds up to exactly 100%) is striking. For any level of risk from around 4% to 15%, significantly higher returns may be achievable using an “&” portfolio. For example, a 22/78/47 portfolio has a return of about 9.3% for a 6.9% risk level, about 170 basis points better than a traditional 30/20/50 portfolio, which offers a return of about 7.6% at that risk level. A 48/52/127 “&” portfolio has the same risk level—about 15%—as the S&P 500 Index, but a return of about 16.75% versus about 9.7%, 700 basis points higher.
Using an increasingly larger overlay, it is possible for investors who are less risk-averse (for example, younger investors with a very long investment horizon) to take on greater risk in the hope of earning higher returns, if their stated risk tolerate allows for it. For example, a 67/33/183 “&” portfolio has a risk level of about 20.8%, higher than the historical risk of the stock market, and a return of about 22%.
One last point is worth noting here: Managed futures exposure is modeled using the BTOP50 Index. In practice, an actively managed portfolio of managed futures strategies would be used, and its risk-return characteristics would likely be quite different from those of the BTOP50 Index. Likewise, this study uses historical returns on stocks and bonds to model portfolios. There is clearly no assurance that the results shown here are in any way representative of what may be achievable in the future, especially as far as returns are concerned. Risk, on the other hand, has tended to be more stable over time. Investors and financial advisors need to do their own modeling and assess their levels of risk tolerance before opting for an “&” portfolio strategy.
Conclusion
Most traditional stock/bond portfolios derive most of their risk from the equity market. For two reasons, this is true even for portfolios that try to diversify risk by allocating to alternative return streams. First, during severe market meltdowns, the alternative assets selected (such as real estate, long-short equity, high yield bonds, options strategies, long-only commodities, etc.), often turn out to be more correlated to stocks than expected. Second, the allocations to alternatives tend to be too small to be meaningful, at least in part because investors and advisors are reluctant to reduce exposure to stock and bonds because of the opportunity cost of being underexposed in a rising market. Thus, the problem is framed as what we call an “OR” decision.
We propose an alternative solution that utilizes the “power of &.” Instead of selling stocks and/or bonds in order to gain exposure to uncorrelated return streams, we suggest the use of an overlay approach. Stocks and bonds continue to be held in the portfolio as before, and they are used as the collateral for the overlay. Thus, the investor gets exposure to stocks and bonds AND uncorrelated alternatives, rather than choosing between one OR the other. Of course, the allocation to stocks and bonds can be strategically adjusted over time as in any other portfolio.
The overlay approach we propose has other potential benefits. As the strategies and trading programs we propose to use trade mainly futures and forwards, it is possible to obtain sufficient exposure to these alternative streams to truly diversify a stock/bond portfolio and to potentially provide a higher risk-adjusted return, while also potentially reducing the “equity-related” risk of the portfolio. Further, the types of return streams we propose using have historically maintained low, even negative, correlations to stocks during market meltdowns, thereby resulting in shallower drawdowns and a smoother ride; in turn, this reduces investors’ likelihood of bailing out at the worst possible time.
All the results shown above are based on the BTOP50 Index. In practice, strategies and trading programs constructed and run by skilled and proven managers can be blended into a portfolio and managed to a volatility target. Some of the strategies used, such as equity hedging programs, can be selected and customized based on the composition of the stock/bond portfolio. An actively managed overlay of this type has the potential to outperform a passive index such as the BTOP50, net of the fees paid to the managers of the trading programs. We believe that the providers of such overlays should be confident enough in their abilities to tie their fees to the performance of the overlays and to the value they add, thus aligning their interests with those of the end investors.
Our proposed solution offers investors the ability to diversify their stock/bond portfolios adequately, reducing equity market risk and smoothing drawdowns, while potentially improving the portfolio’s risk-adjusted return. Investors can diversify effectively without having to sell their core stocks and bonds, and can choose the level of risk suitable for them based on their risk-aversion and life-cycle needs. If the solution is structured creatively, they can achieve these benefits at a reasonable cost.
That, in short, is the power of “&.”
Footnotes
[1] See, for example, the 1986 landmark paper, “Determinants of Portfolio Performance,” Gary P. Brinson, L. Randolph Hood, and Gilbert L. Beebower, which concludes that asset allocation is the primary determinant of a portfolio’s return variability, with security selection and market-timing playing minor roles. We will consider “alternative” asset classes later.
[2] This is the flip side of the magic of compounding. A 50% gain, with $100 growing to $150, can be wiped out by just a −33% loss, as losing $50 out of the $150 brings one back to the starting value of $100.
[3] See, for example, numerous DALBAR reports Quantitative Analysis of Investor Behavior.
[4] Please see our insight, The Risk Contribution of Stocks.
[5] Please reference our Insights library through the Thought Leadership tab on equinoxfunds.com
[6] For example, if investment-grade bonds or liquid ETFs are used, 90% or more of their market value can generally be used as collateral, representing a haircut of less than 10%.
[7] Please reference our Insights library through the Thought Leadership tab on equinoxfunds.com
[8] In theory, there is no reason to limit the managed futures allocation to 100%; the constraint on how much can be allocated depends on how much collateral is required, and that is based on the trading programs selected.
[9] In fact, it is possible to relax even this constraint by using futures markets to obtain additional exposure to equity or bond markets, but that is a topic for another day.
- Explore Categories
- Commentary
- Event
- Manager Writes
- Opinion
- Profile
- Research
- Sponsored Statement
- Technical