We are expecting another healthy year for the US economy. It is creating jobs at a robust pace. The Federal Reserve (Fed) has ended quantitative easing (QE), and is debating a potential short-term rate rise. The US federal budget is heading for near balance in FY-2016 and potentially a small surplus in FY-2017. The regulatory uncertainty associated with the phased-in nature of the rule-making surrounding the Dodd-Frank Act of 2010 is abating. And the financial risks in the economy appear to be considerably lower than before the Great Recession of 2008-2009. This positive view of the US economy is predicated on some key assumptions about the state of the world economy. While low inflation and possible deflation will remain on the radars of major central banks, the concerns over global growth are overrated. Low inflation is not always a sign of weak economic demand, especially in a period of booming commodity supplies.
Europe was held back in 2014 by a lack of credit growth as banks cleaned up their balance sheets ahead of the European Central Bank (ECB) stress tests. With these tests now in the rear-view mirror, a better functioning credit market may allow for 1.0% to 1.5% real GDP growth in the Eurozone. Currently, there is a lot of attention on Greece, which has some risks. This situation bears careful watching, but its bark is loud and economic importance small.
Japan posted back-to-back quarters of real GDP contraction in 2014 after raising the national sales tax in April. The lagged impact of the sales tax hike is mostly over, and the positive effects from a depreciated yen and lower oil prices suggest 1% to 2% real GDP growth in 2015.
Of the major emerging market countries, China is still decelerating and real GDP growth of less than 7% is likely in 2015. India is on a stronger growth path given the reforms of their new government. Some incremental improvement in growth in Mexico and Brazil seems likely as well, although they are likely to remain well below their longer-term potential growth rates.
The countries that are most negatively impacted by low oil prices, including Russia, Norway, Nigeria, Venezuela, Iraq and Iran, are not particularly meaningful for the global economic picture. We view a low commodity price environment, from energy to metals to agriculture, as a positive factor for global growth because we see this development as much more supply-driven than reflective of global demand challenges. Some oil-producing countries may experience a recession in 2015, but the global economy will remain in a moderate growth mode, not the exceptional expansion of the 2002-2007 period. All in all, the glass seems more than half full, even if the global economy is unlikely to return to the go-go period for emerging markets prior to the financial panic of 2008 and the Great Recession in the mature economies.
US real GDP outlook
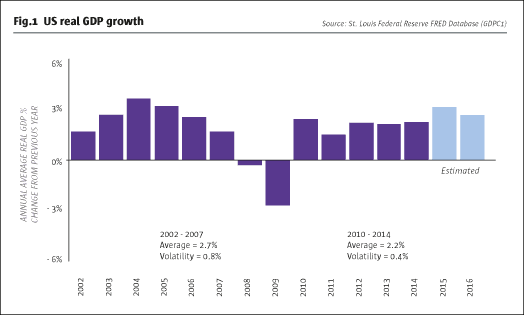
Our base case scenario has the US economy getting into the 3% real GDP territory in 2015 (see Fig.1). As 2014 started, we thought the 3% mark could be exceeded in calendar 2014, but the incredibly difficult winter of Q1/2014 eliminated that possibility. Nevertheless, the bounce-back from the winter of Q1/2014 was strong, and the US economy is now on a 3%-plus real GDP growth track. And our year ago projection of an unemployment rate below 6% by Q4/2014 was on target.
There are risks on both the upside and downside of this base case scenario. Most of the downside potential emanates from international factors.
There are always geopolitical tensions, and should any events escalate these tensions more broadly, global growth prospects, including US growth, could be negatively impacted. China also remains an economy on the watch list. The deceleration of economic growth is a natural consequence of the country’s success and modernization, such that heyday decades of 10% annual growth are now receding into the past. A negative development for our base case would be if the growth deceleration evolved into something much more severe, taking Chinese real GDP growth much lower and more quickly than currently anticipated.
On the upside, the biggest risk remains that general market and economic expectations are too pessimistic. We have made this same point in past years, and while fears generated by the Great Recession are receding, we still believe that certain mature economies, in general, and the US economy, in particular, could outperform even our more optimistic views. There is also a risk in our base scenario that we are underestimating the positive contribution from sharply lower crude oil prices. Our view is that consumers will save money on transportation and heating costs, and spend those savings on discretionary items, which will give a boost to consumer confidence, but not result in all that much of an increase in total retail spending. In any case, we would argue that the risk of falling back into recession is very low, and the upside and downside risks to our US base case are relatively well balanced.
Robust labour market
One of the less appreciated positive factors in the US economy’s expansion since the Great Recession of 2008-2009 has been job creation in the private sector. Private sector job creation has been robust since 2010 and picked up speed in 2014.
Over the past few years, there have been so many analysts and pundits putting forth a pessimistic view on job creation that market expectations are only now catching up with the sheer magnitude of what the US private sector has accomplished despite some powerful headwinds that include a stagnant Europe, decelerating growth in China, weak growth in many emerging market countries, fiscal austerity in the US at the federal level since 2010, and severe cutbacks in US state and local governments which only ended in mid-2013. Indeed, the five years (2010-2014) of continuous economic expansion produced a net increase of more than 10 million jobs.
Sometimes the most positive factor for an economy can be the elimination of a major source of drag. That was the case for the US jobs market in 2014. There was a net loss of over 850,000 jobs in the government sector from 2010 through mid-2013. While some government jobs were lost in the years immediately after the 1980-1982 double-dip recession, more typically there was some government job growth in the recovery period. This time around, there were special circumstances prevailing in the government sector. The 2002-2006 economic expansion was largely driven by a real estate market fuelled by the Greenspan Fed and lax regulation of sub-prime mortgage lenders. Since state and local governments often receive considerable revenues from property taxes, these were boom years and there was strong job growth in the government sector. With the collapse of housing prices in 2007-2009, state and local governments saw revenues decline and needed to make significant cutbacks in services and staffing. This deleveraging process finally ended in the summer of 2013. So with a major headwind eliminated, job growth for the whole economy accelerated in 2014.
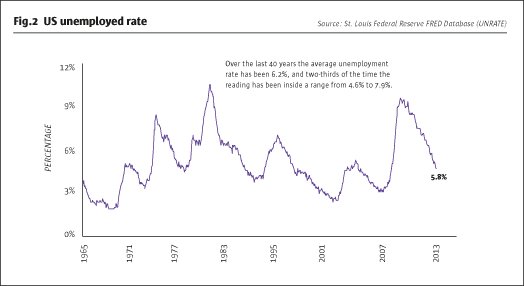
The result of the strong net job growth has been a steadily declining unemployment rate (see Fig.2). With the jobless rate below 6% during Q4/2014, the economy has moved below the average unemployment rate of 6.2% that has prevailed for the last 40 years, since the mid-1960s.
All this good news for the US labour market has not stopped many analysts, including Fed chair Janet Yellen, from worrying about the pace of the economic recovery. We have written about this extensively in the past.
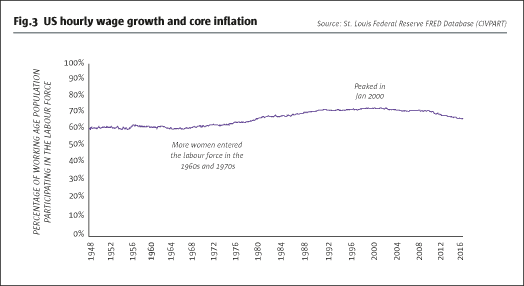
We would note, though, that one of the most discussed concerns – the falling rate of labour market participation – is not something new or merely brought on by the financial crisis of 2008 or the Great Recession that ensued. Labour market participation rates peaked back in January 2000, 15 years ago (see Fig.3).
From our perspective, the declining labour market participation rate reflects a myriad of structural factors, none of which are within the realm of the Fed to influence. Namely, older workers are more plentiful with the ageing demographic trend, and some of them are choosing to leave the labour force earlier than usual. Younger millennials are often involved in entrepreneurial pursuits in greater numbers than previous generations and may not always be counted as being in the labour force. Working-age people are taking advantage of improved disability coverage and some have left the labour force. These structural issues need to be better understood and examined. There may be legislative reforms that could reverse or stall the declining trend, but Fed policies from QE to zero rates are unlikely to make any difference at all.
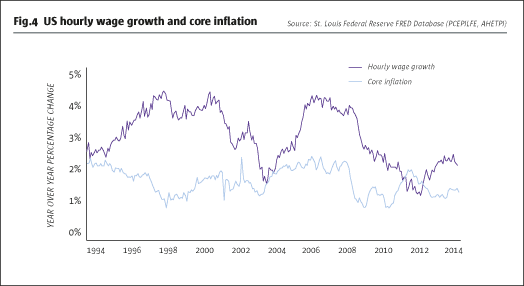
Another labour market concern of the Yellen Fed has been the lack of growth in hourly wages. Indeed, a reading of the speeches of some of the Fed governors and regional Fed presidents suggests that they hold to the view that a pick-up in hourly wage growth will be a predictor of future inflationary pressure (see Fig.4). This view found some empirical support in the late 1960s and inflationary 1970s, but the relationship between wage growth and inflation has been totally elusive in the last 20 years.
Our perspective is that a growing economy eventually leads to the acceleration of wage growth, but with a substantial lag, which works both ways. The impact of a recession appears in decelerating hourly wage growth for a number of years into the economic expansion. Because the Great Recession was particularly deep and also marked by substantial deleveraging in the consumer, business, and government sectors in the post-recession period, hourly wage growth deceleration did not end until 2012 and the subsequent acceleration has been slow. Even though some further acceleration of wage growth is likely in 2015, we would not expect this to result in any material inflationary pressure measured by the core consumer price index.
Sustained low-inflation environment
Indeed, given the robust health of the job creation process, the main reason the Fed has not yet decided whether or when to raise short-term rates and abandon the near-zero federal funds rate policy is the muted inflation pressure and the fact that the measured core inflation rate remains below the 2% long-term objective of the Fed. What is critical to appreciate, however, is that the US core inflation rate has been in the 1.0% to 2.5% range for over two decades.
Sustained low inflation is not a new post-recession trend; it has been the prevailing pattern ever since the early 1990s. Despite a tech boom and bust, a housing boom and bust, and now five years of sustained economic expansion, core inflation has been in a very tight zone, especially when compared with the previous period, 1967-1993, which saw much higher average inflation, with over four times the volatility.
For 2015, external forces such as lower commodity prices led by crude oil, and the lagged impacts of the US dollar’s appreciation in 2014 against the Japanese yen, euro, and most emerging market currencies, are likely to mean that core inflation remains below 2%.
The policy question for the Fed remains, however, whether a near-zero federal funds rate target is appropriate even for a low-inflation economy that has reeled off five consecutive years of positive real GDP growth and has a robust job creation record.
The rate-rise debate within the Fed
From where we sit at the start of 2015, we have the Fed’s balance sheet at $4.5 trillion after several massive rounds of QE. This is roughly a quarter of nominal GDP, and compares with an $800 billion Fed balance sheet in the years before the Great Recession. With the Yellen Fed officially ending QE in October 2014, 2015 is poised to be the year of the rate rise debate in the Federal Open Market Committee (FOMC) and among market participants.
A look back at the history of the federal funds rate (and short-term rates in general) suggests that keeping short-term rates below the prevailing rate of core inflation is highly unusual (see Fig.5). Economic theory would suggest that a more balanced policy where short-term rates are anchored around the core inflation rate would still be classified as an accommodative policy, although not as accommodative as the negative real short-term rate policy in effect for the last five years.
With this sense of historical context, five years of economic expansion, and robust job growth, our view is that during 2015, and possibly sooner rather than later, the Fed’s FOMC will decide to abandon its near-zero short-term rate policy and decide to push short-term rates upward to be more or less equal to the prevailing core rate of inflation. As we have suggested above, this would still be characterized as an accommodative policy. Indeed, we think the signalling effect, namely that the economy is strong enough not to need emergency-induced zero rates, will actually contribute positively to consumer confidence.
Moreover, a move to push short-term rates up to the core inflation rate will eliminate the tax (i.e., negative real short-term rates) on substantial classes of savers which may also prove a positive factor for the US economy.
We want to note a couple of details that might be important for analysing the debate surrounding a potential Fed rate-rise decision. First, before raising its target range for the federal funds rate, the Fed may well choose to stop re-investing the interest and principal it receives on its holdings of mortgage-backed securities and US Treasuries. An announcement to this effect would be a strong signal of a rate rise coming soon. Second, when/if the rate-rise decision is actually made, the step-by-step, 25 basis-point-increments approach of the Greenspan Fed may be rejected for a more rapid shift. That is, if the objective is to get from near-zero to a target federal funds range of 1.00% to 1.25%, this might be accomplished in one big well-advertised leap, or in just two steps instead of four. The logic is that once the FOMC decides on a rate move, it might as well do it quickly and eliminate the meeting-to-meeting uncertainty of a drawn-out incremental process. And finally, the federal funds market is quite different than it once was before QE. The Fed’s balance sheet is so large that there are over $2 trillion of excess reserves. So, directly managing the target federal funds rate range with repurchase activities may no longer be possible. More likely, the Fed will signal the new range with a statement about federal funds, but enforce the new range by raising the rate of interest it pays on excess reserves, now at 0.25% annually. We estimate that a rate of interest on excess reserves of 1.25% would approximately imply a federal funds rate of about 1.10% without the need for repurchase operations.
Approaching federal budget balance
While we have given priority to an examination of monetary policy, fiscal policy is worth several comments. The last year of President Bush’s administration witnessed the financial crisis, which led to Treasury Secretary Paulson proposing and the US Congress authorising a $1 trillion emergency spending programme. This money was largely spent in 2009 when the federal budget deficit as a percentage of nominal GDP rose to about 10%. Since the spending surge in 2009, which was also accompanied by a sharp drop in tax receipts due to the Great Recession, gridlock in the US Congress has meant no new expenditure programmes. In each year from 2010, with the moderate growth in real GDP, there has been even higher growth in federal receipts. Holding expenditures nearly flat for five years with growing receipts has meant a very rapid reduction in the federal budget deficit, from -10% of GDP in FY-2009, to about -3% in FY-2014. And we now project near balance in FY-2016, and a very small surplus in FY-2017.
Of course, after the Presidential elections of FY-2016 and a newly elected US Congress as well, the budget might take a different path, should the voting public send a message that gridlock is not the way forward. We would, therefore, not hold much confidence that the years of a balanced budget would extend beyond FY-2017.
We also want to point out that the reduction in the budget deficit from -10% of GDP in FY-2009 to a projected very small surplus in FY-2017 represents a very tight fiscal policy stance. The idea that monetary policy can be used to offset fiscal policy is overrated in our view, and this makes the performance of the US economy over the last five years even more impressive.
A whiff of volatility
Our concluding thoughts revolve around prospective developments in the longer-term market for US Treasury securities.
Absent an inflation shock, as observed in the 1970s, or a massive asset purchase programme from the Fed similar to the Bernanke Fed’s QE operations, it is very unusual for 10-year US Treasury yields to dip below the core rate of inflation (see Fig.6). That is, barring highly unusual circumstances, there is likely to be a premium in 10-year Treasury note yields relative to the prevailing rate of core inflation. In the 1970s, market participants were regularly surprised by upward inflationary pressure, so 10-year yields lagged the rate of inflation, making for a smaller premium. In the 1980s and into the early 1990s, the surprise was the rapid deceleration of inflation, and so the premium in yields relative to inflation was quite wide, narrowing slowly as inflation expectations became more stable.
Consequently, our perspective is that any break-out from the current range of 10-year Treasury note yields, either upward or downward, will be accompanied by compelling evidence that the pattern of core inflation is changing. We do not see this happening in 2015. The strength of the US dollar in 2014 will exert some downward pressure on core inflation in 2015, while the health of the economy might provide a small counterweight. And a change in Fed policy on rates is not likely to have any impact at all on the inflation pattern or inflation expectations.
The end of QE in 2014 and the debate about Fed rate policy in 2015 is likely to lead to a little more volatility in both the short end of the yield curve and the long end. The sustained period of near-zero short-term rates plus the Fed’s asset buying programmes helped to take volatility out of the yield curve. Some volatility is returning to the markets. We would note, however, that so long as core inflation is between 1% and 2% and the volatility of inflation expectations is at very low levels, we do not think bond market volatility will go above its former historical norms.
Equity markets will also be impacted by the return of some modest volatility to bond markets. The larger driver for increased equity market volatility, however, comes from the low inflation rate. Sustained low inflation implies a lack of pricing power by companies, and that in turn implies relatively low, although positive, earnings growth. 5% or 6% earnings growth would be a good performance for a 1% to 2% core inflation economy in the sixth year of an economic expansion, but earnings growth in the mid-single digits is a prescription for equity market volatility.
Erik Norland is Senior Economist at CME Group. Blu Putnam is Chief Economist and Managing Director at CME Group.
- Explore Categories
- Commentary
- Event
- Manager Writes
- Opinion
- Profile
- Research
- Sponsored Statement
- Technical
Commentary
Issue 101
US 2015 Economic Outlook
America will lead the way globally
ERIK NORLAND and BLU PUTNAM, CME GROUP
Originally published in the January 2015 issue