2017 was a remarkably calm year in equities, with key indicators showing the lowest volatility since before the 2008 financial crisis. Throughout this period, E-mini S&P 500 futures (ES) maintained elevated levels of market depth, a sign that market participants were comfortable with leaving more and larger orders open for longer periods. This level of market depth was not necessary to support market transactions, as transaction size is typically much smaller. High levels of market depth are not unusual during extended periods of low volatility.
Likewise, when volatility rose suddenly in late January 2018, markets responded as they normally would, by reducing the number and size of orders left open for a significant period of time. The resulting change in market depth initially may have looked like a fall in liquidity. However, volume from that period indicates that the liquidity available was more than sufficient for market participants to execute trades and hedge their risk.
There are, of course, other potential influences driving market depth, leading to the decrease in ES market depth in February. It’s possible that other measures of market health impacted the market depth during this period. These possibilities, including volatility, are examined more thoroughly below, but ultimately, the data supports the belief that volatility is responsible for this change in market depth.
12x
The highest average intra-day price move in February 2017 was 12x higher than in October 2017.
February was a textbook example of how markets react to changes in volatility. While the reaction may have seemed extreme, due to the historically low volatility period that preceded it, the data gives no indication that market depth was inadequate or would not return to higher levels as volatility receded.
Market depth and expiry dates
In general, top of the book market depth of the E-mini S&P 500 contract follows a cyclical pattern in line with quarterly expiry dates. A similar pattern is seen in the volume, which also increases and decreases along the expiry timeline. In fact, it appears that volume and market depth often move in opposite directions as expiries approach, with volumes increasing as market depth decreases.
While there are periods where this relationship seems to break down, if anything, it appears to be stronger during periods of market stress. During the period from late 2015 to early 2016, volumes were much higher than normal for the period, while market depth was lower. This suggests that reductions in market depth are not restricting trading opportunities.
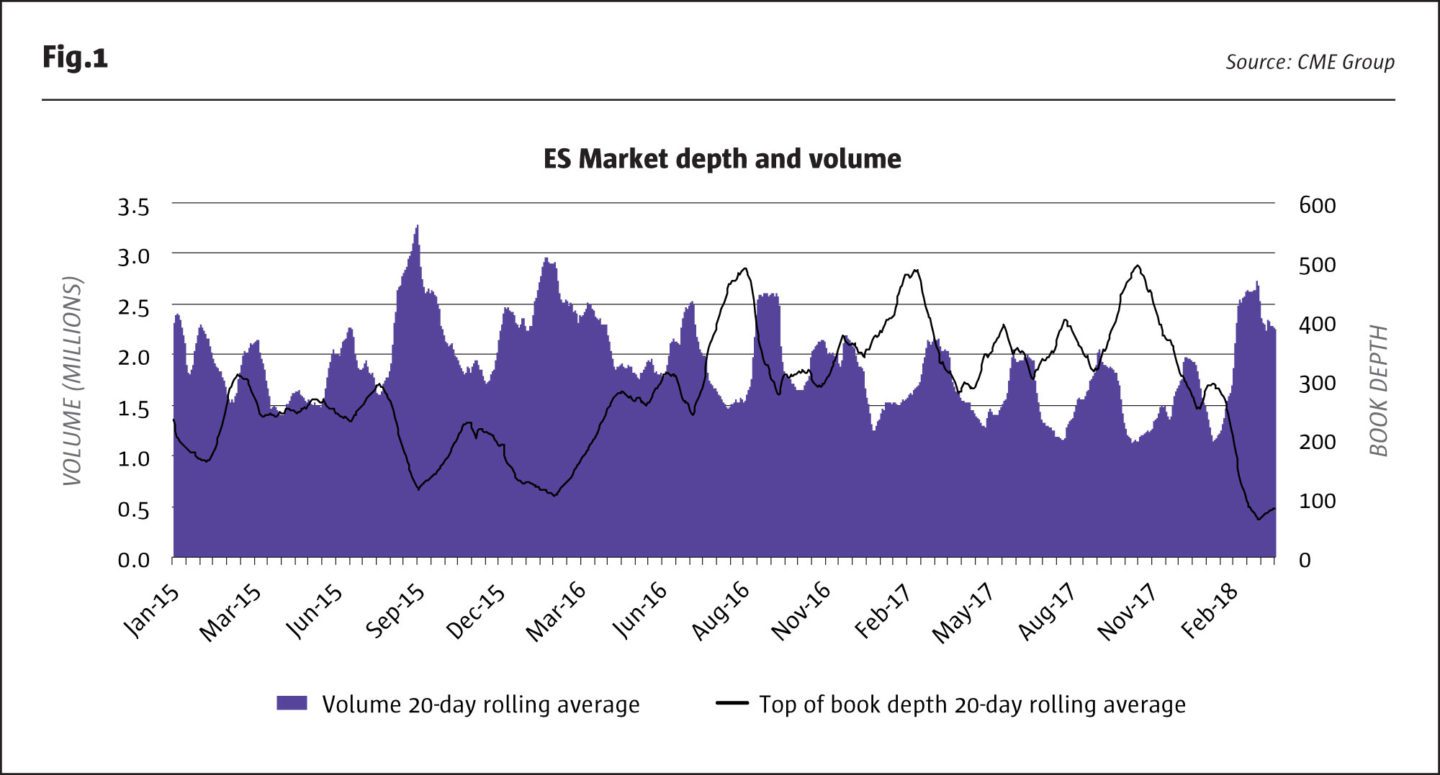
While there are several variables that could have an impact on market depth, there are fluctuations that occur around the contract roll dates.
Market depth and volatility
Beyond the normal quarterly cyclical changes, the key variable impacting market depth appears to be market volatility. In 2017, with volatility very low, the cyclical movements of market depth and volume are clear. Looking back to 2015, a higher volatility period, these patterns split somewhat. However, during periods of higher volatility, market depth does maintain a very clear inverse relationship with the implied volatility.
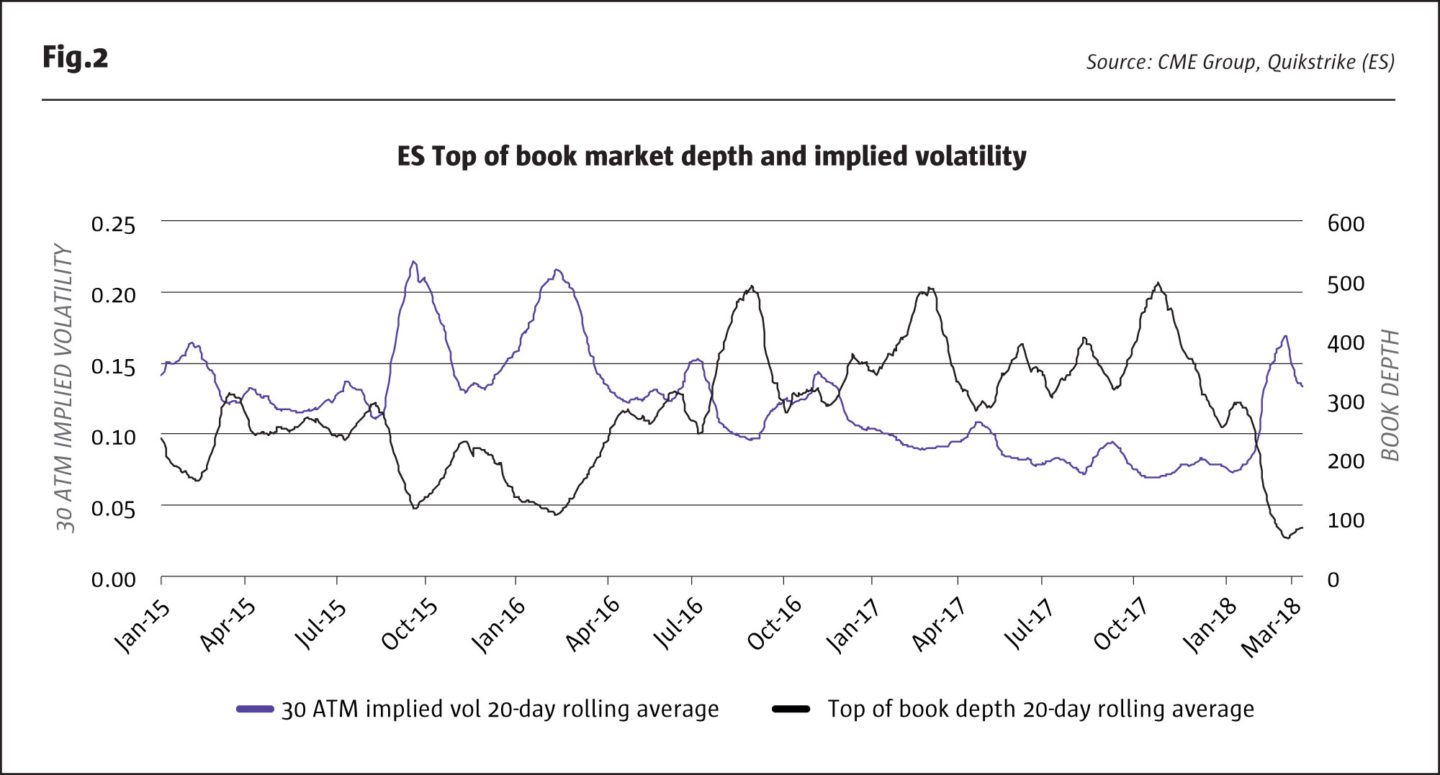
Particularly as the implied volatility increased in late 2015 into early 2016, market depth and volatility are nearly mirror images of one another. Recall that in Figure 1 volumes during this period were quite high, meaning market participants were able to find sufficient liquidity to trade even during a lower book depth.
During the low volatility period in 2017, traders became more and more comfortable leaving orders open for longer periods. As volatility increased, traders could no longer leave orders open without risking the market moving against them, giving rise to the appearance of lower market depth even as significant volume was executed.
The more recent volatility spike in early 2018 similarly drove a decrease in market depth. The extremely low volatility period preceding February led to a larger reaction in the market depth than in previous volatility spikes, though it remained near 100 at the top of the book. As volatility began to come down, market depth appears to be turning up.
The difference between 2018 and the earlier periods of volatility is the timing relative to the cyclical behavior around the roll dates. The market depth rolling average was at a trough in its normal cyclical pattern and was just beginning another upward turn in early 2018 when volatility returned to markets. When the volatility spike hit in February, market depth declined as normal, but the timing, at this natural inflection point, made the results appear more extreme. However, as the volume totals show significant activity in the markets, this market depth was more than sufficient to meet traders’ needs.
Importantly, in each of these volatility spikes, market depth is quick to return to higher levels as volatility comes back down. We don’t see long term impacts to market depth even in the face of extremely high volatility.
Market depth and open interest
Another variable that may be considered to have a relationship with market depth is open interest in the contract, though this theory does not seem to hold. In the below chart there appears to be a similar cyclical pattern to open interest, with open interest rising and falling in line with the roll date. However, during periods of volatility, this relationship breaks down, as seen in late 2015 and early 2016. There was a similar divergence in early 2018.
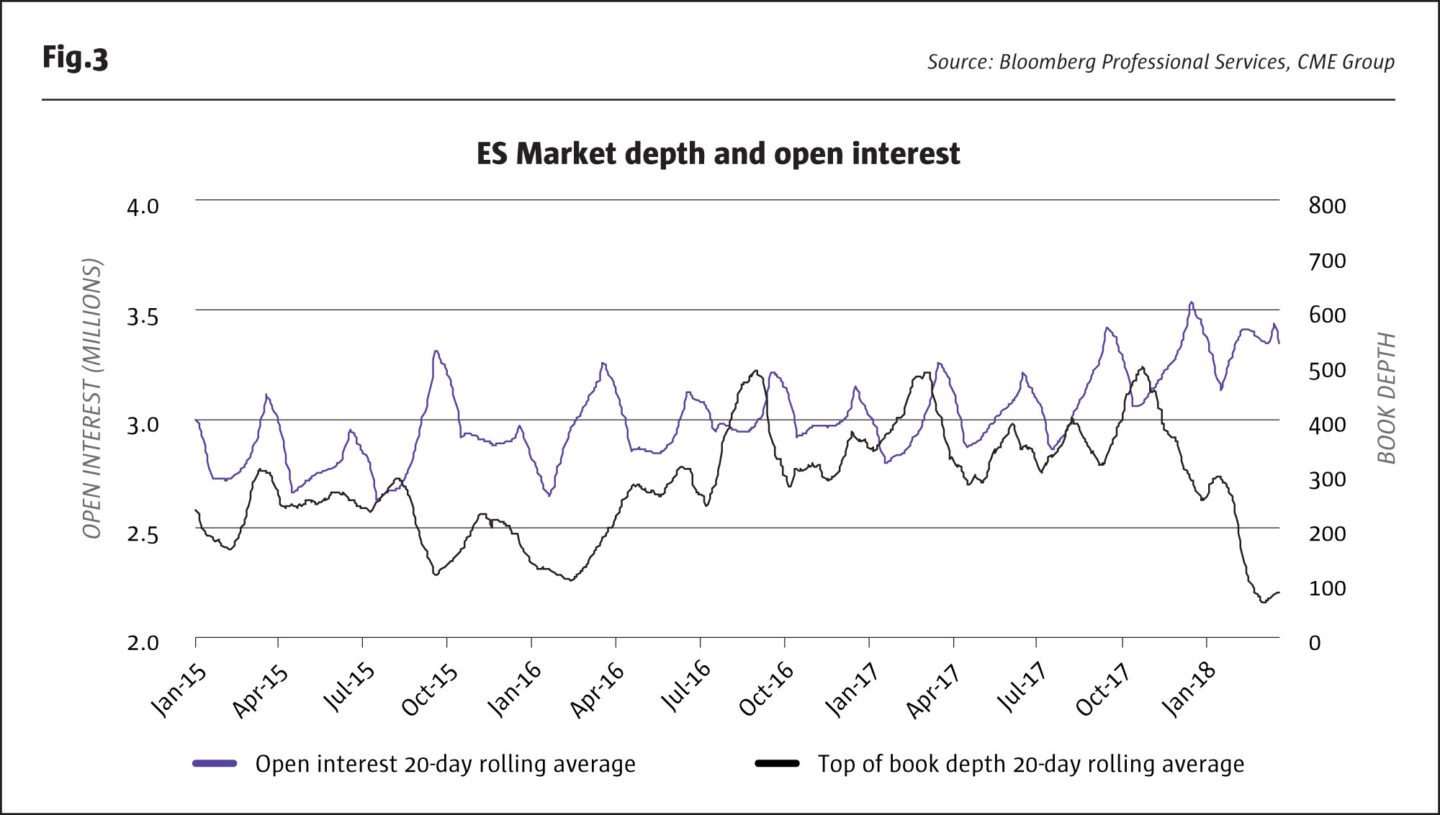
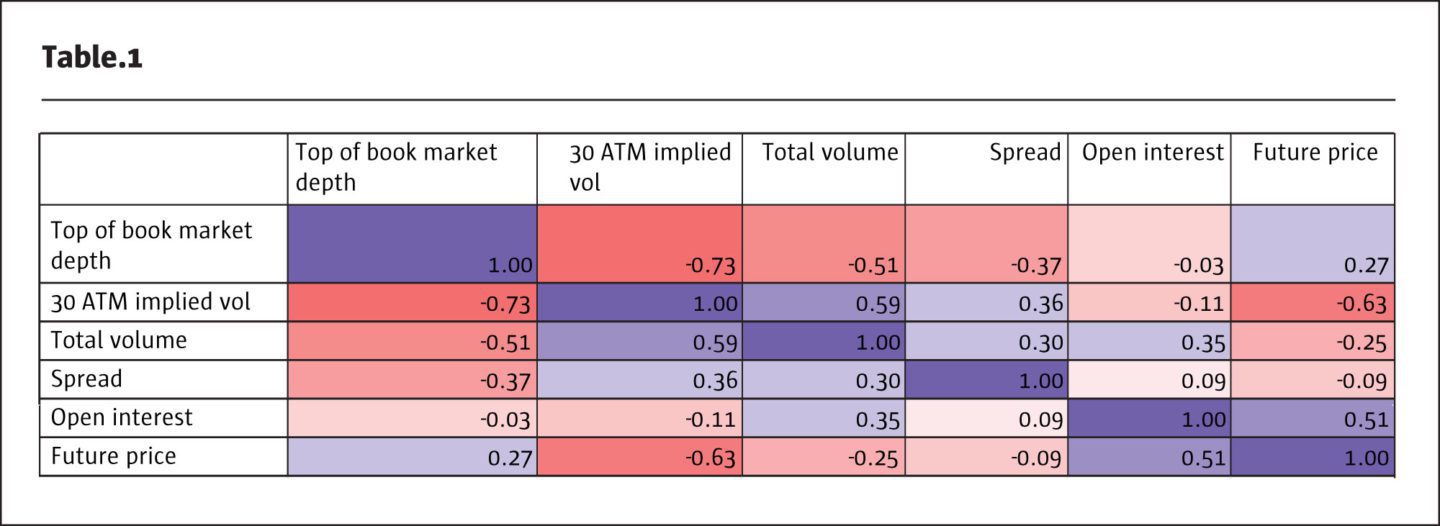
This divergence in response to the market volatility means that the two variables have a low correlation. The data suggest that open interest and market depth are practically unrelated. The table below confirms our expectations based on the charts: volatility has a strong negative relationship with market depth, while open interest barely shows any correlation. Volume, with correlation of -0.51, does increase during periods of lower market depth, meaning traders are able to execute as needed even with lower market depth.
Market depth and price change
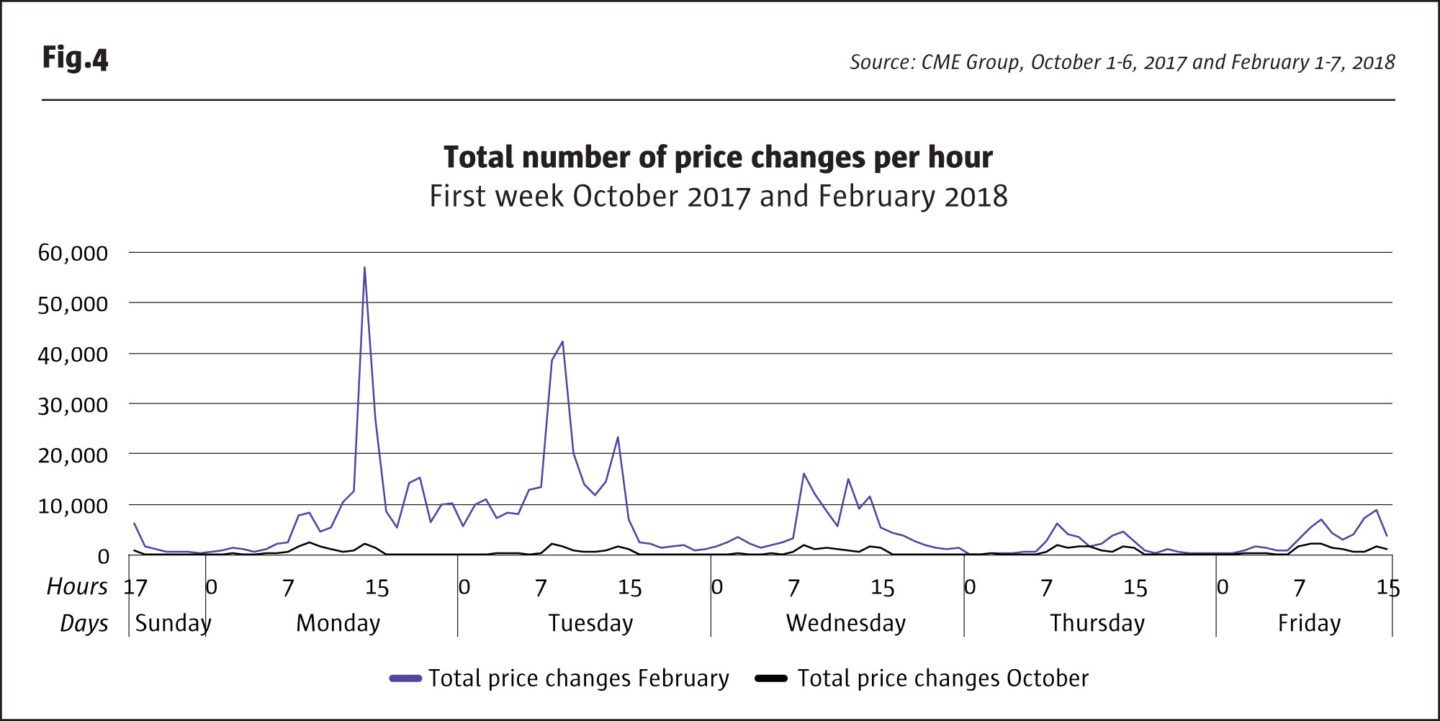
Another measure of market sentiment and volatility is the frequency of price changes. More price changes mean the markets are more active but there is more uncertainty about the actual market price. In times of higher volatility, the number of price changes is expected to increase, and this was the case during the volatility spike in 2018.
The charts below show a 23x increase in the frequency of price changes during the February market spike. As traders rushed to hedge their risk, trading frequency increased, leaving very little time for book depth to replenish.
In addition to the frequency of price changes, the volatility spike in February 2018 saw a significant increase in the magnitude of the price changes. The chart below shows the average price increases and decreases for each day for the same two-week periods, October 1-6, 2017 and February 1-7, 2018. There is a notable increase during the period of volatility around February 5. The highest average intra-day price move in February was 12x higher than in October.
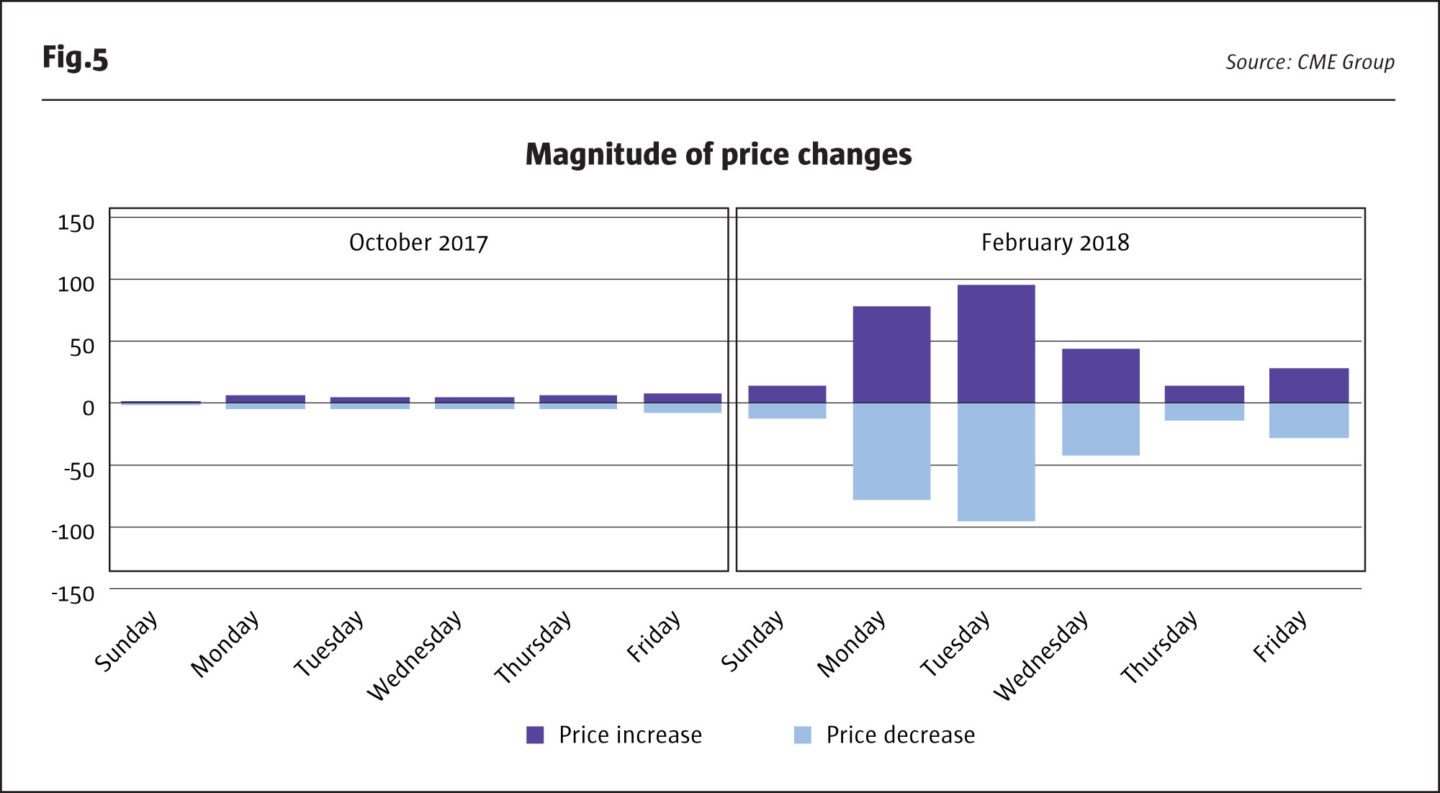
Interestingly, the 23x increase in the frequency of price changes and the 12x increase in price changes correspond with a decrease in the rolling average of market depth of only 2.5x. This means that while market depth does respond to different measures of increased volatility, historically it is at a much lower magnitude than the increased volatility itself.
Conclusion
Ultimately, what traders experienced in February 2018 was a normal market reaction to a spike in volatility. Market depth dipped as traders pulled open orders, and volume increased as traders rushed to hedge their risk against the new market dynamic. February’s response seems to have been slightly more intense than normal, given the prolonged period of low volatility throughout 2017 and the natural lull market depth was experiencing as result of the roll date. However, it does not look to be so far outside of the norms for this market. Indeed, market depth appears to be returning towards more elevated levels as markets became re-accustomed to a higher volatility environment, demonstrating the resiliency of CME’s markets.
- Explore Categories
- Commentary
- Event
- Manager Writes
- Opinion
- Profile
- Research
- Sponsored Statement
- Technical
Commentary
Issue 132
Volatility Returns
Phase transition in equities
Jesy Beeson, Director of Business Intelligence and Erik Norland, Senior Economist and Executive Director, CME Group
Originally published in the May 2018 issue